Alibaba’s DeepSeek Integration Fuels Rally
6 Min. Read Time
Key News
Asian markets, except for Hong Kong and Mainland China, were lower on Trump’s steel and aluminum tariff talk as the US dollar strengthened overnight.
AI continues to fuel Hong Kong and Mainland China’s growth and technology rally, though Trump’s reversal on banning the US Postal Service’s delivery of China packages was a positive. Maybe the US and China are further along in trade talks than the market is anticipating? This could be the reason behind the strength of Hong Kong-listed stocks against a clear negative, i.e. tariffs.
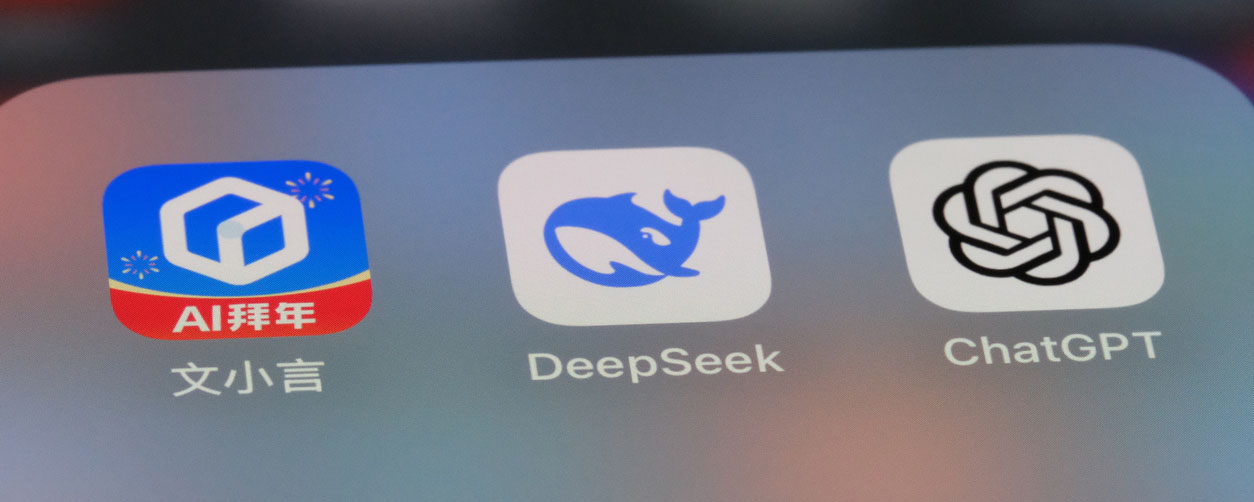
Alibaba gained +5.5% as Alibaba Cloud announced the integration of several DeepSeek models into its platform. Hong Kong had very strong volume and strong breadth, i.e. advancers versus decliners, which technical analysts would love, led by Alibaba’s value of volume, which was 4X pre-stimulus levels, though Tencent gained +2.06% and Meituan gained +5.58%, which had very high volume as well. Alibaba, along with the Hong Kong Tracker ETF and Hang Seng China Enterprise ETF, had very strong net buying via Southbound Stock Connect, as total buying from the Mainland into Hong Kong across all securities totaled $2.11 billion, accounting for 48% of Hong Kong turnover.
4.8% of Alibaba’s Hong Kong-listed shares are now held by Mainland investors via Southbound Stock Connect since its September 2024 addition to the mutual market access program. Year-to-date (YTD), Mainland investors have bought a net $18.87 billion worth of Hong Kong-listed stocks and ETFs via Southbound Connect.
To gauge where we are in the rally, YTD, 3 of the 4 largest US-listed China ETFs are net sells. Out of sight of out mind, I suppose.
Hong Kong-listed Chinese telecom stocks had a good day as they are seen as AI beneficiaries while insurance was off.
Dongfeng Motor Group gained +25.7% and Chongqing Changan Auto gained +6.1% after the companies’ parent companies filed for restructuring, leading to speculation of a merger between the two. The filing is leading to what some believe is a wave of M&A activity that could sweep through the industry against the backdrop of overcapacity.
January’s PPI and CPI releases were non-factors, as the former was -2.3% versus expectations of -2.2% and December’s -2.3% and the latter was up +0.5% versus expectations of +0.4% and December’s +0.1%. Chinese New Year vacation spending was viewed as CPI’s catalyst.
The Mainland animal spirits are not quite as strong as in Hong Kong, though growth stocks and small caps were higher overnight, led by semiconductors, metals, telecom, software and media stocks. Mainland financial media noted that Mainland-listed bond ETFs’ AUM has grown to RMB 200 billion from RMB 100 billion in just 9 months.
The Western media narrative continues to be so negative on China, which may explain the lack of ETF flows noted above. Most investors would guess China is down -50% YoY and not closer to up +50%! Technical analysts continue to note that the occurrence of ever higher highs and higher lows is a called an uptrend!
The Hang Seng and Hang Seng Tech indexes gained +1.84% and +2.65%, respectively, on volume that decreased -1.57% from Friday, which is 175% of the 1-year average. 314 stocks advanced while 168 stocks declined. Main Board short turnover increased +23.5% from Friday, which is 200% of the 1-year average, as 18% of turnover was short turnover (Hong Kong short turnover includes ETF short volume, which is driven by market makers’ ETF hedging). The growth factor and large caps outpaced the value factor and small caps. The top-performing sectors were Consumer Discretionary, which gained +3.55%, Materials, which gained +2.35%, and Technology, which gained +2.19%. Meanwhile, the worst-performing sectors were Energy, which fell -0.13%, and Utilities, which fell -0.33%. The top-performing subsectors were consumer staples distribution, consumer discretionary distribution, and healthcare equipment. Meanwhile, household & personal products, coal, and electrical equipment were among the worst-performing. Southbound Stock Connect volumes were very high as Mainland investors bought a net $2.11 billion worth of Hong Kong-listed stocks and ETFs, including Alibaba, the Hong Kong Tracker ETF, the Hang Seng China Enterprise ETF, which were large net buys, Xiaomi, Meituan and China Mobile, Tencent, and Semiconductor Manufacturing (SMIC).
Shanghai, Shenzhen, and the STAR Board gained +0.56%, +1.08%, and +1.76%, respectively, on volume that declined -11.65% from Friday, which is 157% of the 1-year average. 3,887 stocks advanced while 1,016 declined. The value factor and large caps gained more than the growth factor and small caps. The top-performing sectors were Communication Services, which gained +1.91%, Information Technology, which gained +0.71%, and Health Care, which gained +0.5%. Meanwhile, the worst-performing sectors were Utilities, which fell -0.77%, Energy, which fell -0.70%, and Industrials, which fell -0.65%. The top-performing subsectors were internet, education, and telecom. Meanwhile, soft drinks, motorcycles, and marine & shipping industry were among the worst-performing subsectors. Northbound Stock Connect volumes were just above average. CNY and the Asia Dollar Index both posted small losses versus the US dollar. Treasury bonds fell. Copper rose and steel fell.
Last Night's Performance
| Country/Index | Ticker | 1-Day Change |
|---|---|---|
| China (Hong Kong) | HSI Index | 1.8% |
| Hang Seng Tech | HSTECH Index | 2.6% |
| Hong Kong Turnover | HKTurn Index | -1.6% |
| HK Short Sale Turnover | HKSST Index | 23.5% |
| Short Turnover as a % of HK Turnovr | N/A | 17.7% |
| Southbound Stock Connect Net Buy/Sell (US $ Millions) | N/A | 243.2 |
| China (Shanghai) | SHCOMP Index | 0.6% |
| China (Shenzhen) | SZCOMP Index | 1.1% |
| China (STAR Board) | Star50 Index | 1.8% |
| Mainland Turnover | .chturn Index | -11.7% |
| Nouthbound Stock Connect Net Buy/Sell (US $ Millions) | N/A | Not Available |
| Jing Daily China Global Luxury Index | CHINALUX Index | 0.9% |
| Japan | NKY Index | 0% |
| India | SENSEX Index | -0.7% |
| Indonesia | JCI Index | -1.4% |
| Malaysia | FBMKLCI Index | -0.1% |
| Pakistan | KSE100 Index | 0.9% |
| Philippines | PCOMP Index | -1.9% |
| South Korea | KOSPI Index | 0% |
| Taiwan | TWSE Index | -1% |
| Thailand | SET Index | -0.9% |
| Singapore | STI Index | 0.4% |
| Australia | AS51 Index | -0.3% |
| MSCI China All Shares Index | # of Stocks | Average 1-Day Change (%) |
|---|---|---|
| Hong Kong Listed | 152 | 2.13 |
| Communication Services | 9 | 2.13 |
| Consumer Discretionary | 30 | 3.55 |
| Consumer Staples | 13 | 1.16 |
| Energy | 7 | -0.13 |
| Financials | 23 | 0.89 |
| Health Care | 13 | 0.65 |
| Industrials | 19 | 0.45 |
| Information Technology | 10 | 2.19 |
| Materials | 10 | 2.35 |
| Real Estate | 6 | 1.62 |
| Utilities | 12 | -0.33 |
| Mainland China Listed | 432 | 0 |
| Communication Services | 9 | 1.92 |
| Consumer Discretionary | 31 | 0.06 |
| Consumer Staples | 27 | -0.47 |
| Energy | 16 | -0.69 |
| Financials | 63 | -0.07 |
| Health Care | 40 | 0.5 |
| Industrials | 69 | -0.64 |
| Information Technology | 85 | 0.72 |
| Materials | 68 | 0.46 |
| Real Estate | 7 | 0.13 |
| Utilities | 17 | -0.76 |
| US & Hong Kong Dually Listed | Ticker | 1-Day Change (%) |
|---|---|---|
| Tencent HK | 700 HK Equity | 2.1 |
| Alibaba HK | 9988 HK Equity | 5.5 |
| JD.com HK | 9618 HK Equity | 2.8 |
| NetEase HK | 9999 HK Equity | 1.9 |
| Yum China HK | 9987 HK Equity | -2.7 |
| Baozun HK | 9991 HK Equity | 5.8 |
| Baidu HK | 9888 HK Equity | 3.7 |
| Autohome HK | 2518 HK Equity | 0.9 |
| Bilibili HK | 9626 HK Equity | 0.6 |
| Trip.com HK | 9961 HK Equity | 2.3 |
| EDU HK | 9901 HK Equity | 1.2 |
| Xpeng HK | 9868 HK Equity | -1 |
| Weibo HK | 9898 HK Equity | 0.1 |
| Li Auto HK | 2015 HK Equity | 2.3 |
| Nio Auto HK | 9866 HK Equity | 0.3 |
| Zhihu HK | 2390 HK Equity | 5.9 |
| KE HK | 2423 HK Equity | 2.9 |
| Tencent Music Entertainment HK | 1698 HK Equity | 1.4 |
| Meituan HK | 3690 HK Equity | 5.6 |
| Hong Kong's Most Heavily Traded by Value | 1-Day Change (%) |
|---|---|
| ALIBABA GROUP HOLDING LTD | 5.5 |
| TENCENT HOLDINGS LTD | 2.1 |
| MEITUAN-CLASS B | 5.6 |
| XIAOMI CORP-CLASS B | 3.1 |
| SEMICONDUCTOR MANUFACTURING | 2.5 |
| CHINA MOBILE LTD | 2.2 |
| BYD CO LTD-H | 0.1 |
| AIA GROUP LTD | -0.9 |
| GEELY AUTOMOBILE HOLDINGS LT | 0 |
| KUAISHOU TECHNOLOGY | 2.9 |
| Shanghai and Shenzhen's Most Heavily Traded by Value | 1-Day Change (%) |
|---|---|
| IEIT SYSTEMS CO LTD-A | 0.9 |
| EAST MONEY INFORMATION CO-A | 0.2 |
| ISOFTSTONE INFORMATION TEC-A | 6.1 |
| SICHUAN CHANGHONG ELECTRIC-A | 10 |
| ZTE CORP-A | -1.5 |
| BYD CO LTD -A | 1 |
| JIANGSU HOPERUN SOFTWARE C-A | 2 |
| DAWNING INFORMATION INDUST-A | 2 |
| 360 SECURITY TECHNOLOGY IN-A | 6.4 |
| OFILM GROUP CO LTD-A | 8.7 |
Last Night's Exchange Rates, Prices, & Yields
- CNY per USD 7.30 versus 7.29 yesterday
- CNY per EUR 7.53 versus 7.53 yesterday
- Yield on 10-Year Government Bond 1.63% versus 1.61% yesterday
- Yield on 10-Year China Development Bank Bond 1.63% versus 1.61% yesterday
- Copper Price +0.87%
- Steel Price -0.62%