Mea Trumpa
6 Min. Read Time
Key News
Asian equity markets had a very strong day after President Trump hit the pause button on tariff implementation, except for Mainland China, with a near double-digit return in Japan and Taiwan. However, India missed out on the fun due to a market holiday for Mahavir Jayanti, a festive in Jainism celebrating the birth of Lord Mahavira.
The crack in the tariff façade, driven by the US Treasury 10-Year yield hitting 5% Tuesday night, fueled Hong Kong and Mainland China’s broad beta rally, led by growth stocks, as advancers outpaced decliners significantly on high volumes. It it great to see markets providing a real-time ECON 101 lesson, though the tuition costs paid by the US and global investors in US stocks at $10 trillion are most unfortunate.
Both China's Ministry of Commerce (MoC) and Ministry of Foreign Affairs held press conferences reiterating that China will not back down, though left the door open for US negotiations. As we have stated, the Chinese government’s negotiating position is far stronger than realized due to the misperception that all 1.4 billion Chinese working in factories depend entirely on trade with the US. Our webinar this morning will review this data.
The Ministry of Commerce Minister Wang Wentao was busy hosting calls with the Minister of Malaysian Trade and Industry and the European Commission’s Committee on Trade and Economic Security. China filed another complaint on US tariffs with the World Trade Organization’s Council for Trade in Goods, which requires a sixty-day consultation. While DC might not care about the World Trade Organization (WTO), I suspect the rest of the world does.
There was a fair amount of media coverage that the Chinese government held a high-level economic meeting, though I could find no evidence of such a meeting from our local sources. The lack of evidence nor any policy stimulus announced might explain the fade off intra-day highs. There are rumors that a major domestic consumption policy will be announced now that Trump’s tariffs on China have been announced. The National Healthcare Security Administration announced the establishment of the Fertility Insurance Professional Committee.
Pro-consumption stimulus will likely address structural headwinds, including demographics—electric vehicle (EV) and hybrid battery maker CATL, which gained +3.12%, as its Hong Kong-listing moves forward. March's producer price index (PPI) was light at -2.5% versus expectations of -2.3% and February’s -2.2%, while the consumer price index (CPI) was -0.1% versus expectations of 0.0% and February's -0.7%.
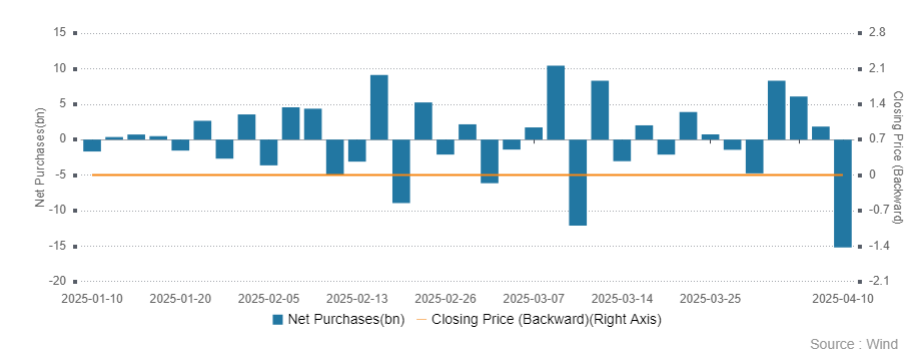
Mainland investors sold both the Hong Kong Tracker ETF and Hang Seng China Enterprise ETFs in size, making Southbound Stock Connect a rare net sell day, at a net -$519 million sold. Alibaba and Xiaomi were very large net buys today. Mainland-listed hardware and electronic device makers had a very strong day, though transportation stocks were off.
Wall Street Journal journalists Joanna Stern and Nicole Nguyen wrote a great piece titled “An American-Made iPhone: Just Expensive or Completely Impossible?”. The article outlines many challenges, such as sourcing parts from forty countries and lacking skilled labor. It's a worthwhile read! I continue to applaud data discovery in the media and, to some degree, DC.
The Hang Seng and Hang Seng Tech indexes gained +2.06% and +2.60%, respectively, on volume that decreased -4.09% from yesterday, which is 227% of the 1-year average. 410 stocks advanced, while 72 stocks declined. Main Board short turnover decreased -7.13% from yesterday, which is 294% of the 1-year average, as 20% of turnover was short turnover (Hong Kong short turnover includes ETF short volume, which is driven by market makers’ ETF hedging). Growth, momentum, and small caps outperformed the value factor and large caps. All sectors were positive. The top-performing sectors were Materials, which gained +4.29%, Information Technology, which gained +3.49%, and Real Estate, which gained +2.92%. The top-performing subsectors were consumer staples distribution, nonferrous metals, and aerospace. Meanwhile, coal was the only negative subsector. Southbound Stock Connect volumes were 5X pre-stimulus levels, as Mainland investors sold a net -$519 million worth of Hong Kong-listed stocks and ETFs, including Alibaba and Xiaomi, which were very large net buys, Meituan, which was a moderate net buy, Tencent, Semiconductor Manufacturing International (SMIC), Kuaishou, and CNOOC. The Hong Kong Tracker ETF and Hang Seng China Enterprise ETFs were massive net sells.
Shanghai, Shenzhen, and the STAR Board all closed higher by +1.16%, +2.46%, and +1.09%, respectively, on volume that decreased -5.24% from yesterday, which is 140% of the 1-year average. 4,793 stocks advanced, while 299 stocks declined. Growth, momentum, and small caps outperformed value and large caps. Utilities were the only negative sector, down -0.2%, while the top-performing sectors were Consumer Discretionary, which gained +3.15%, Materials, which gained +3.03%, and Information Technology, which gained +2.93%. The top-performing subsectors were motorcycles, precious metals, and retail. Meanwhile, telecom, soft drink, and land transport were among the worst-performing subsectors. Northbound Stock Connect volumes were above average. CNY and the Asia dollar index rose versus the US dollar. Treasury bonds rallied. Copper and steel rose.
Hong Kong Tracker ETF’s Southbound Stock Connect Inflow/Outflow
Last Night's Performance
| Country/Index | Ticker | 1-Day Change |
|---|---|---|
| China (Hong Kong) | HSI Index | 2.1% |
| Hang Seng Tech | HSTECH Index | 2.7% |
| Hong Kong Turnover | HKTurn Index | -4.1% |
| HK Short Sale Turnover | HKSST Index | -7.1% |
| Short Turnover as a % of HK Turnovr | N/A | 19.9% |
| Southbound Stock Connect Net Buy/Sell (US $ Millions) | N/A | 0 |
| China (Shanghai) | SHCOMP Index | 1.2% |
| China (Shenzhen) | SZCOMP Index | 2.5% |
| China (STAR Board) | Star50 Index | 1.1% |
| Mainland Turnover | .chturn Index | -5.2% |
| Nouthbound Stock Connect Net Buy/Sell (US $ Millions) | N/A | Not Available |
| Jing Daily China Global Luxury Index | CHINALUX Index | 3.1% |
| Japan | NKY Index | 9.1% |
| India | SENSEX Index | -0.5% |
| Indonesia | JCI Index | 4.8% |
| Malaysia | FBMKLCI Index | 4.5% |
| Pakistan | KSE100 Index | 1.6% |
| Philippines | PCOMP Index | 1.2% |
| South Korea | KOSPI Index | 6.6% |
| Taiwan | TWSE Index | 9.2% |
| Thailand | SET Index | 4.2% |
| Singapore | STI Index | 5.4% |
| Australia | AS51 Index | 4.5% |
| Vietnam | VNINDEX Index | 6.8% |
| MSCI China All Shares Index | # of Stocks | Average 1-Day Change (%) |
|---|---|---|
| Hong Kong Listed | 151 | 1.6 |
| Communication Services | 9 | 0.97 |
| Consumer Discretionary | 28 | 1.67 |
| Consumer Staples | 13 | 2.78 |
| Energy | 7 | 0.15 |
| Financials | 23 | 1.27 |
| Health Care | 13 | 2.37 |
| Industrials | 20 | 1.64 |
| Information Technology | 10 | 3.48 |
| Materials | 10 | 4.28 |
| Real Estate | 6 | 2.92 |
| Utilities | 12 | 0.62 |
| Mainland China Listed | 404 | 1.87 |
| Communication Services | 6 | 2.94 |
| Consumer Discretionary | 31 | 3.2 |
| Consumer Staples | 24 | 0.71 |
| Energy | 13 | 0.71 |
| Financials | 64 | 1.46 |
| Health Care | 31 | 1.68 |
| Industrials | 64 | 1.85 |
| Information Technology | 91 | 2.99 |
| Materials | 58 | 3.08 |
| Real Estate | 6 | 1.65 |
| Utilities | 16 | -0.15 |
| US & Hong Kong Dually Listed | Ticker | 1-Day Change (%) |
|---|---|---|
| Tencent HK | 700 HK Equity | 0.8 |
| Alibaba HK | 9988 HK Equity | 1.2 |
| JD.com HK | 9618 HK Equity | 3.7 |
| NetEase HK | 9999 HK Equity | 1.2 |
| Yum China HK | 9987 HK Equity | 0.1 |
| Baozun HK | 9991 HK Equity | -3.2 |
| Baidu HK | 9888 HK Equity | 2.4 |
| Autohome HK | 2518 HK Equity | 0.5 |
| Bilibili HK | 9626 HK Equity | 0.7 |
| Trip.com HK | 9961 HK Equity | 3.5 |
| EDU HK | 9901 HK Equity | -0.9 |
| Xpeng HK | 9868 HK Equity | 4.4 |
| Weibo HK | 9898 HK Equity | 2 |
| Li Auto HK | 2015 HK Equity | 4.8 |
| Nio Auto HK | 9866 HK Equity | 3.9 |
| Zhihu HK | 2390 HK Equity | 3.7 |
| KE HK | 2423 HK Equity | -0.6 |
| Tencent Music Entertainment HK | 1698 HK Equity | 3 |
| Meituan HK | 3690 HK Equity | -0.7 |
| Hong Kong's Most Heavily Traded by Value | 1-Day Change (%) |
|---|---|
| TENCENT HOLDINGS LTD | 0.8 |
| ALIBABA GROUP HOLDING LTD | 1.2 |
| XIAOMI CORP-CLASS B | 2.7 |
| MEITUAN-CLASS B | -0.7 |
| SEMICONDUCTOR MANUFACTURING | 2 |
| BYD CO LTD-H | 2.7 |
| HSBC HOLDINGS PLC | 5.6 |
| HONG KONG EXCHANGES & CLEAR | 1.7 |
| CHINA CONSTRUCTION BANK-H | 1.3 |
| KUAISHOU TECHNOLOGY | 3.8 |
| Shanghai and Shenzhen's Most Heavily Traded by Value | 1-Day Change (%) |
|---|---|
| EAST MONEY INFORMATION CO-A | 0 |
| LUXSHARE PRECISION INDUSTR-A | 7.1 |
| CHINA GREATWALL TECHNOLOGY-A | -0.5 |
| CONTEMPORARY AMPEREX TECHN-A | 3.1 |
| CHINA TOURISM GROUP DUTY F-A | 5 |
| BYD CO LTD -A | 3.6 |
| YONGHUI SUPERSTORES CO LTD-A | 3.1 |
| VICTORY GIANT TECHNOLOGY -A | 5.1 |
| ZIJIN MINING GROUP CO LTD-A | 5.2 |
| KWEICHOW MOUTAI CO LTD-A | 0.5 |
Last Night's Exchange Rates, Prices, & Yields
- CNY per USD 7.32 versus 7.34 yesterday
- CNY per EUR 8.10 versus 8.10 yesterday
- Yield on 10-Year Government Bond 1.64% versus 1.65% yesterday
- Yield on 10-Year China Development Bank Bond 1.71% versus 1.71% yesterday
- Copper Price +1.94%
- Steel Price +1.50%