Alibaba, NetEase, & KE Holdings Report Q1
6 Min. Read Time
Key News
Asian equities were mixed but mostly lower overnight after substantial gains from the 90-day US-China tariff deal, as India and Pakistan outperformed, while Thailand and Hong Kong underperformed.
The South China Morning Post reported that US-bound shipping orders increased nearly 300% after the 90-day pause was announced, reflecting still-strong demand from US businesses and consumers for China-made goods despite tensions. Airplane makers in Mainland China were sold off on the potential for a resurgence of purchases of US-made Boeing airplanes as a condition of a deal between China and the US.
CNY has been highly resilient amid "Art of The Deal" tariffs, appreciating 0.8% versus the US dollar since April 2nd.
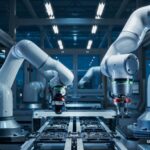
Huawei has partnered with UB Tech to build humanoid robots. The collaboration will allow UB Tech, a robot manufacturer, to benefit from Huawei’s newfound competency in the high-end chips required for training and maintaining AI systems. Humanoid robots are a recurring theme in China and in the markets. When visiting China, I am always impressed by the ubiquity of robots for cleaning and delivering room service.
Mainland markets outperformed Hong Kong somewhat. Volumes were near the one-year average in both markets, as Mainland investors were rare net sellers of Hong Kong-listed stocks and ETFs. Mainland investors were net sellers of Tencent after the company released stronger-than-expected Q1 results yesterday, which included high profit margin expansion. The company's success in Q1 highlights the continuing strong consumer rebound in China because it derives a significant amount of its revenue from advertising and marketing services, which are often the highest margin segments of its business.
Q1 Earnings Reports
% changes are year-over-year unless otherwise indicated.
Alibaba
- Revenue +7% RMB 221.9B ($30.8B) versus expectations of RMB 237.9 billion ($33.0B)
- Adjusted Net Income RMB 25.3B ($3.4B) versus expectations of RMB 31.0B ($4.3B)
- Adjusted Earnings per Share (EPS) RMB 10.14 ($1.4) versus expectations of RMB 12.7 ($1.8)
Alibaba had a quarter of strong growth in key segments, though it thoroughly missed estimates on net income and top-line revenue. Alibaba may not have benefited as much as its peers, especially JD.com, from trade-in subsidies. Although Alibaba continues to reward its shareholders, buying back $11.9 billion worth of shares in the past year, directing capital toward shareholders and away from investments in technology for growth may have dented its top-line growth. Nonetheless, coud growth accelerated significantly to 18%, driven by strong adoption of AI models, especially Alibaba’s industry-leading Q-wen. Company executives have mentioned the immense cross-selling opportunities for Alibaba Cloud as demand for inference, i.e. large language models, rises. Alibaba continues to be a leader in AI development and is likely to continue to innovate and grow in this category. Alibaba may, in future quarters, devote more capital to R&D and investment in growth than in previous quarters. China commerce (Taobao & Tmall) revenue increased 9%, as 88VIP members, the high-spending category, have reached over 50 million.
NetEase
- Revenue +7% to RMB 28.8B ($4.0B) versus expectations of RMB 28.5B ($4.0B)
- Adjusted Net Income RMB 11.2B ($1.5B) from RMB 8.5B versus expectations of RMB 9.0B ($1.3B)
- Adjusted Earnings per Share (EPS) RMB 17.5 ($2.4) versus expectations of RMB 13.7 ($1.9)
NetEase had a strong beat on net income and a moderate beat on top line revenue for the first quarter of 2025. It is good to see that the reactivation of their games partnership with Microsoft is not curtailing margins. Games revenue accelerated quite forcefully to 15%. The company also boasts a strong games pipeline, with titles including MARVEL Mystic Mayhem, Destiny: Rising, and Ananta. NetEase’s open world games will also likely benefit from its AI-enhanced non-player characters (NPCs).
KE Holdings
- Revenue +42% to RMB 23.3B ($3.2B) versus expectations of RMB 22.5B ($3.1B)
- Adjusted Net Income from RMB 1.4B ($0.2) versus expectations of RMB 1.2B ($0.2)
- Adjusted Earnings per Share (EPS) RMB 1.2 ($0.2) versus expectations of RMB 0.9 ($0.1)
KE Holdings, which operates the “Beike” online and brick-and-mortar real estate platform, which is akin to Zillow or Street Easy in the United States, reported first quarter results that beat estimates on revenue and net income. The recent uptick in China’s real estate, especially new housing, market benefited KE’s revenue growth.
| Country / Index | Ticker | 1-Day Change |
|---|---|---|
| China (Hong Kong) | HSI Index | -0.8% |
| Hang Seng Tech | HSTECH Index | -1.6% |
| Hong Kong Turnover | HKTurn Index | -10.2% |
| Hong Kong Short Sale Turnover | HKSST Index | -7.7% |
| Short Turnover as a % of Hong Kong Turnover | N/A | 15.1% |
| Southbound Stock Connect Net Buy/Sell (US $ Millions) | N/A | -279.6 |
| China (Shanghai) | SHCOMP Index | -0.7% |
| China (Shenzhen) | SZCOMP Index | -1.4% |
| China (STAR Board) | Star50 Index | -1.3% |
| Mainland Turnover | .chturn Index | -12.6% |
| Northbound Stock Connect Net Buy/Sell (US $ Millions) | N/A | Not Available |
| Jing Daily China Global Luxury Index | CHINALUX Index | -0.4% |
| Japan | NKY Index | -1% |
| India | SENSEX Index | 1.5% |
| Indonesia | JCI Index | 0.9% |
| Malaysia | FBMKLCI Index | -0.7% |
| Pakistan | KSE100 Index | 0.9% |
| Philippines | PCOMP Index | -1.3% |
| South Korea | KOSPI Index | -0.7% |
| Taiwan | TWSE Index | -0.2% |
| Thailand | SET Index | -1.8% |
| Singapore | STI Index | 0.5% |
| Australia | AS51 Index | 0.2% |
| Vietnam | VNINDEX Index | 0.3% |
| Indicator | Hong Kong | Mainland China |
|---|---|---|
| Today's Volume % of 1-Year Average | 104 | 93 |
| Advancing Stocks | 120 | 1178 |
| Declining Stocks | 357 | 3812 |
| Outperforming Factors | Low Volatility, Quality, High Dividend | Low Volatility, Value, Large Caps |
| Underperforming Factors | Liquidity, Growth | Liquidity, Growth, Momentum |
| Top Sectors | Utilities | Utilities |
| Bottom Sectors | Communication, Consumer Discretionary, Consumer Staples | Information Technology, Communication, Real Estate |
| Top Subsectors | Household & Personal Products, Consumer Durables, Media & Entertainment | Chemicals, Soft Drinks |
| Bottom Subsectors | Semiconductors, Consumer Staples Distribution, Non-Ferrous Metals | Internet, Software, Computer Hardware |
| Southbound Connect Buys | China Construction Bank, China Mobile, Li Auto | N/A |
| Southbound Connect Sells | Tencent, Pop Mart, Semiconductor Manufacturing International (SMIC) | N/A |
| MSCI China All Shares Index | # of Stocks | Average 1-Day Change (%) |
|---|---|---|
| Hong Kong Listed | 151 | -0.89 |
| Communication Services | 9 | -0.5 |
| Consumer Discretionary | 28 | -1.24 |
| Consumer Staples | 13 | -0.79 |
| Energy | 7 | -1 |
| Financials | 23 | -0.7 |
| Health Care | 13 | -0.57 |
| Industrials | 20 | -0.72 |
| Information Technology | 10 | -1.17 |
| Materials | 10 | -1.98 |
| Real Estate | 6 | -2.15 |
| Utilities | 12 | 0.17 |
| Mainland China Listed | 404 | -0.94 |
| Communication Services | 6 | -1.32 |
| Consumer Discretionary | 31 | -0.65 |
| Consumer Staples | 24 | -0.46 |
| Energy | 13 | -0.1 |
| Financials | 64 | -0.83 |
| Health Care | 31 | -0.1 |
| Industrials | 64 | -1.04 |
| Information Technology | 91 | -2.35 |
| Materials | 58 | -1.03 |
| Real Estate | 6 | -1.2 |
| Utilities | 16 | 0.71 |
| US & Hong Kong Dually Listed | Ticker | 1-Day Change (%) |
|---|---|---|
| Tencent HK | 700 HK Equity | -0.2 |
| Alibaba HK | 9988 HK Equity | -1.2 |
| JD.com HK | 9618 HK Equity | -4.4 |
| NetEase HK | 9999 HK Equity | 1.2 |
| Yum China HK | 9987 HK Equity | -1 |
| Baozun HK | 9991 HK Equity | -3.9 |
| Baidu HK | 9888 HK Equity | -1.4 |
| Autohome HK | 2518 HK Equity | 0.1 |
| Bilibili HK | 9626 HK Equity | -2.3 |
| Trip.com HK | 9961 HK Equity | 0.2 |
| EDU HK | 9901 HK Equity | -0.3 |
| Xpeng HK | 9868 HK Equity | -1.1 |
| Weibo HK | 9898 HK Equity | -1.7 |
| Li Auto HK | 2015 HK Equity | -1.3 |
| Nio Auto HK | 9866 HK Equity | -2.5 |
| Zhihu HK | 2390 HK Equity | -1.3 |
| KE HK | 2423 HK Equity | -5.5 |
| Tencent Music Entertainment HK | 1698 HK Equity | 6.8 |
| Meituan HK | 3690 HK Equity | -2.9 |
| Hong Kong's Most Heavily Traded by Value | 1-Day Change (%) |
|---|---|
| TENCENT HOLDINGS LTD | -0.2 |
| ALIBABA GROUP HOLDING LTD | -1.2 |
| XIAOMI CORP-CLASS B | -0.5 |
| BYD CO LTD-H | 1.4 |
| MEITUAN-CLASS B | -2.9 |
| SEMICONDUCTOR MANUFACTURING | -3.4 |
| AIA GROUP LTD | 0.8 |
| JD.COM INC-CLASS A | -4.4 |
| CHINA CONSTRUCTION BANK-H | 0.4 |
| PING AN INSURANCE GROUP CO-H | -2.3 |
| Shanghai and Shenzhen's Most Heavily Traded by Value | 1-Day Change (%) |
|---|---|
| EAST MONEY INFORMATION CO-A | -3.2 |
| BYD CO LTD -A | 1 |
| AVIC CHENGDU AIRCRAFT CO L-A | -3.7 |
| EOPTOLINK TECHNOLOGY INC L-A | -2.5 |
| ZHONGJI INNOLIGHT CO LTD-A | -4.3 |
| KWEICHOW MOUTAI CO LTD-A | -0.2 |
| TALKWEB INFORMATION SYSTEM-A | -4.6 |
| LUXSHARE PRECISION INDUSTR-A | -2.6 |
| COSCO SHIPPING HOLDINGS CO-A | -1.9 |
| CONTEMPORARY AMPEREX TECHN-A | -0.9 |
Last Night's Exchange Rates, Prices, & Yields
- CNY per USD 7.21 versus 7.20 yesterday
- CNY per EUR 8.08 versus 8.11 yesterday
- Yield on 10-Year Government Bond 1.67% versus 1.67% yesterday
- Yield on 10-Year China Development Bank Bond 1.72% versus 1.70% yesterday
- Copper Price -0.14%
- Steel Price 0.39%