Xiaomi’s Results Roar (Quietly) As Hong Kong & Mainland China Take a Breather
6 Min. Read Time
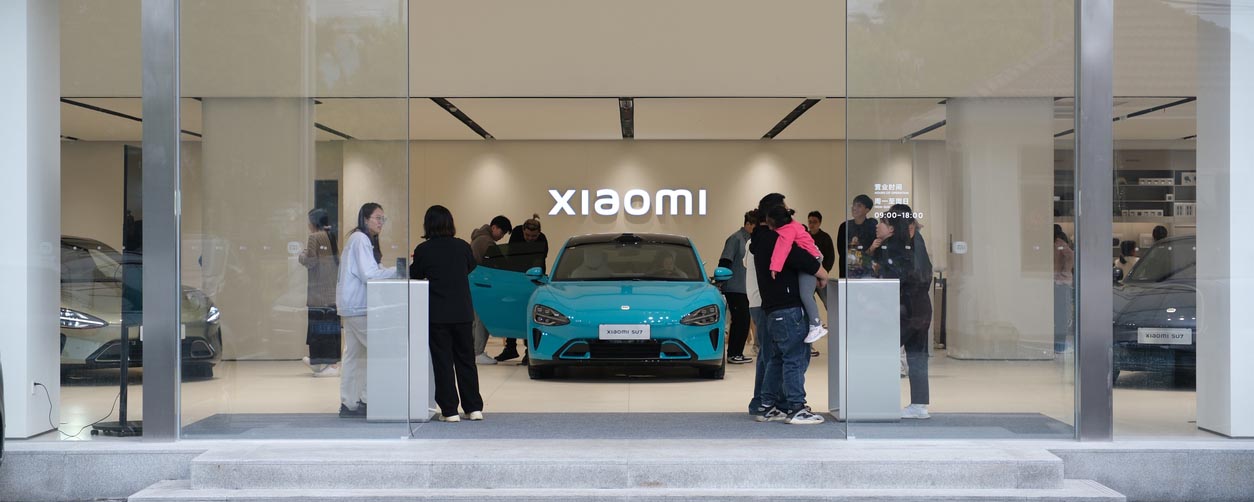
Xiaomi Q2 Earnings Overview
Xiaomi fell by -1.23% in Hong Kong trading but reported earnings after the market's close.
- Revenue increased by +30.5% year-over-year (YoY) to RMB 115.96B from RMB 88.89 and versus expectations of RMB 114.90.
- Adjusted Net Income increased by +75.4% YoY to RMB 10.83B from RMB 6.18B and versus expectations of RMB 10.20B.
- Adjusted EPS increased.
- In the second quarter of 2025, electric vehicle (EV) total deliveries were 81,302 vehicles, which accounted for RMB 20.6 billion in revenue. This figure puts Xiaomi's EV segment up to ~18% of revenue, which is up from ~7% of revenue YoY.
- Smart phones/AIoT accounted for 81.70% of revenue, which is down from 92.80% YoY.
Xpeng Q2 Earnings Overview
Xpeng fell by -1.85% in Hong Kong trading.
- Revenue increased by 125.30% YoY to RMB 18.27B ($2.55B).
- Vehicle sale revenue increased by +147.60% to RMB 16.88B ($2.36B).
- Vehicle gross margin was 14.30% despite Chairman and CEO Xiaopeng He stating the company faced “intense industry-wide price competition”.
- Adjusted net loss decreased to RMB 390 million from a loss of RMB -1.22 billion and versus loss estimates of RMB -851 million.
- Adjusted EPS decreased to RMB -0.20 versus loss estimates of RMB -0.62.
- Q3 revenue was RMB 19.60B to RMB21B versus estimates of RMB 21.06B.
- Q3 vehicle estimates were 113,000 to 118,000 versus Q2’s 103,181 and Q2 2024’s 30,207.
Key News
A bigger piece of news after the close was that the Ministry of Industry and Information Technology (MIIT) held a symposium on competition in the solar industry, highlighting efforts to standardize competition and promote the orderly exit of outdated production capacity. The MIIT will strengthen price monitoring and enforcement against practices such as sales below cost and false advertising. It will be interesting to watch how US-listed China solar stocks respond, as this could affect Hong Kong and Mainland markets tomorrow.
Asian equities were mixed as Vietnam gained 1%, Hong Kong closed lower for the fourth consecutive day, and Mainland China took a breather after its market cap hit a 10-year high .
Profit taking centered on growth stocks and sub-sectors, but Tencent (+0.94%) and electronics held up well, aided by Premier Li’s positive comments on domestic consumption. East Buy Holding was a notable decliner, dropping -20.89% in Hong Kong and -3.41% in Mainland China after reaching 52-week highs yesterday, reportedly on an unconfirmed rumor.
Meanwhile, Mainland investors bought the Hong Kong dip in volume, with $2.38 billion in net buying, and strong flows into the Hong Kong Tracker ETF following Friday’s $4.58 billion of net buying.
The 1 and 3-Year Loan Prime Rates (LPRs), set at 3% and 3.5% respectively, are not expected to change; the 3-year rate remains the reference rate for mortgages. Diplomatic relations between India and China seem to be improving, as China has agreed to sell rare earths to India following Foreign Minister Wang Yi’s visit.
Having returned from a family holiday, I’m still shaking off the proverbial mental fog, although my wife insists that’s a permanent state, and she’s got plenty of evidence, too. I missed that Tong Cheng Travel reported Q2 financial results yesterday after the Hong Kong close, posting beats in revenue, adjusted net income, and adjusted earnings per share (EPS). It is worth noting that 2020 revenue was RMB 5.93 billion, and the 2025 revenue estimate is RMB 19.51 billion, yet the stock has only risen 35% over the past five years. This is fairly typical in our space, where revenues multiply but stock appreciation lags.
Last Night's Performance
| Country / Index | Ticker | 1-Day Change |
|---|---|---|
| China (Hong Kong) | HSI Index | -0.2% |
| Hang Seng Tech | HSTECH Index | -0.7% |
| Hong Kong Turnover | HKTurn Index | -11.1% |
| Hong Kong Short Sale Turnover | HKSST Index | 3.8% |
| Short Turnover as a % of Hong Kong Turnover | N/A | 16.9% |
| Southbound Stock Connect Net Buy/Sell (US $ Millions) | N/A | 2372.043550447 |
| China (Shanghai) | SHCOMP Index | 0% |
| China (Shenzhen) | SZCOMP Index | 0.1% |
| China (STAR Board) | Star50 Index | -1.1% |
| Mainland Turnover | .chturn Index | -6.4% |
| Northbound Stock Connect Net Buy/Sell (US $ Millions) | N/A | Not Available |
| Jing Daily China Global Luxury Index | CHINALUX Index | 1.3% |
| Japan | NKY Index | -0.4% |
| India | SENSEX Index | 0.5% |
| Indonesia | JCI Index | -0.4% |
| Malaysia | FBMKLCI Index | 0.3% |
| Pakistan | KSE100 Index | 1% |
| Philippines | PCOMP Index | -0.2% |
| South Korea | KOSPI Index | -0.8% |
| Taiwan | TWSE Index | -0.5% |
| Thailand | SET Index | -0.5% |
| Singapore | STI Index | 0.7% |
| Australia | AS51 Index | -0.7% |
| Vietnam | VNINDEX Index | 1.1% |
| Indicator | Hong Kong | Mainland |
|---|---|---|
| Today's Volume % of 1-Year Average | 127% | 177% |
| Advancing Stocks | 193 | 2747 |
| Declining Stocks | 290 | 2198 |
| Outperforming Factors | Dividend Yield, Value, Low Volatility | Growth, Low Volatility |
| Underperforming Factors | Momentum, Liquidity, EPS Revisions | EPS Revisions, Quality, Large Caps |
| Top Sectors | Staples, Communication, Discretionary | Staples, Tech, Real Estate |
| Bottom Sectors | Healthcare, Tech, Industrials | Healthcare, Industrials, Energy |
| Top Subsectors | Textiles/Apparel, Food/Beverages, Consumer Services | Soft Drink, Forest, Diversified Financials |
| Bottom Subsectors | National Defense, Semis, Pharmaceuticals | Insurance, Aerospace, Securities/Brokerage |
| Southbound Connect Buys | HK Tracker ETF (MASSIVE), HS China Enterprise ETF (Very Large), Tencent, Xiaomi (Large), Alibaba (Small) | |
| Southbound Connect Sells | East Buy, SMIC (Moderate) |
| MSCI China All Shares Index | # of Stocks | Average 1-Day Change (%) |
|---|---|---|
| Hong Kong Listed | 151 | 0.05 |
| Communication Services | 9 | 0.88 |
| Consumer Discretionary | 28 | 0.34 |
| Consumer Staples | 13 | 1.08 |
| Energy | 7 | 0.03 |
| Financials | 23 | -0.39 |
| Health Care | 13 | -2.09 |
| Industrials | 20 | -0.82 |
| Information Technology | 10 | -1.31 |
| Materials | 10 | -0.68 |
| Real Estate | 6 | -0.3 |
| Utilities | 12 | -0.17 |
| Mainland China Listed | 404 | -0.14 |
| Communication Services | 6 | -0.58 |
| Consumer Discretionary | 31 | 0.25 |
| Consumer Staples | 24 | 0.95 |
| Energy | 13 | -0.63 |
| Financials | 64 | -0.62 |
| Health Care | 31 | -1.16 |
| Industrials | 64 | -0.64 |
| Information Technology | 91 | 0.62 |
| Materials | 58 | -0.44 |
| Real Estate | 6 | 0.38 |
| Utilities | 16 | 0.28 |
| US & Hong Kong Dually Listed | Ticker | 1-Day Change (%) |
|---|---|---|
| Tencent HK | 700 HK Equity | 0.9 |
| Alibaba HK | 9988 HK Equity | -0.3 |
| JD.com HK | 9618 HK Equity | -0.6 |
| NetEase HK | 9999 HK Equity | -1.3 |
| Yum China HK | 9987 HK Equity | 0.8 |
| Baozun HK | 9991 HK Equity | -2.5 |
| Baidu HK | 9888 HK Equity | 0 |
| Autohome HK | 2518 HK Equity | -3.1 |
| Bilibili HK | 9626 HK Equity | -0.1 |
| Trip.com HK | 9961 HK Equity | 1.4 |
| EDU HK | 9901 HK Equity | -2.2 |
| Xpeng HK | 9868 HK Equity | -1.8 |
| Weibo HK | 9898 HK Equity | 0 |
| Li Auto HK | 2015 HK Equity | -2.4 |
| Nio Auto HK | 9866 HK Equity | 0.8 |
| Zhihu HK | 2390 HK Equity | 23 |
| KE HK | 2423 HK Equity | -0.9 |
| Tencent Music Entertainment HK | 1698 HK Equity | -2 |
| Meituan HK | 3690 HK Equity | -0.6 |
| Hong Kong's Most Heavily Traded by Value | 1-Day Change (%) |
|---|---|
| TENCENT HOLDINGS LTD | 0.9 |
| EAST BUY HOLDING LTD | -20.9 |
| ALIBABA GROUP HOLDING LTD | -0.3 |
| XIAOMI CORP-CLASS B | -1.2 |
| SEMICONDUCTOR MANUFACTURI-H | -3.4 |
| MEITUAN-CLASS B | -0.6 |
| SINO BIOPHARMACEUTICAL | -6.6 |
| HUA HONG SEMICONDUCTOR LTD-H | -3.1 |
| INNOVENT BIOLOGICS INC | -4.1 |
| GEELY AUTOMOBILE HOLDINGS LT | 3.2 |
| Shanghai and Shenzhen's Most Heavily Traded by Value | 1-Day Change (%) |
|---|---|
| EAST MONEY INFORMATION CO-A | -3.4 |
| CHINA NORTHERN RARE EARTH -A | 3.6 |
| FOXCONN INDUSTRIAL INTERNE-A | 10 |
| WUXI APPTEC CO LTD-A | -6.9 |
| JIANGSU HOPERUN SOFTWARE C-A | 8 |
| EOPTOLINK TECHNOLOGY INC L-A | 5.1 |
| WOLONG ELECTRIC GROUP CO L-A | 3.7 |
| ZHONGJI INNOLIGHT CO LTD-A | 6 |
| BEIJING COMPASS TECHNOLOGY-A | 0.5 |
| CAMBRICON TECHNOLOGIES-A | -1.7 |
Last Night's Exchange Rates, Prices, & Yields
- CNY per USD 7.17 versus 7.18 yesterday
- CNY per EUR 8.39 versus 8.39 yesterday
- Yield on 10-Year Government Bond 1.77% versus 1.78% yesterday
- Yield on 10-Year China Development Bank Bond 1.89% versus 1.91% yesterday
- Copper Price -0.18%
- Steel Price -0.91%