Investors Love Alibaba’s AI & Cloud Growth
5 Min. Read Time
Key News
Asian markets were mixed overnight following a strong Monday session, as US investors enjoyed a three-day Labor Day weekend. The highlight of the weekend, aside from time with friends and family, was witnessing my buddy Brian get his first hole-in-one, which was amazing!
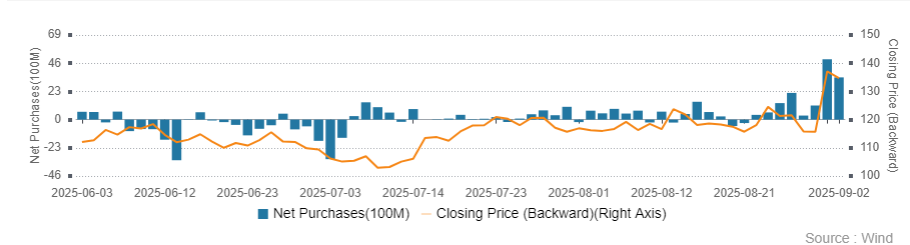
On Monday, Alibaba surged +18.46% in Hong Kong following Friday’s post-close results, powered by AI and Cloud strength, while Alibaba's US listing advanced +12.9% on Friday. Mainland investors were significant buyers of Alibaba’s Hong Kong-listed shares via Southbound Stock Connect both yesterday and today (see chart below).
Alibaba’s Net Inflow & Stock Price Via Southbound Stock Connect.
BYD dropped -5.24% Monday after missing analyst expectations, particularly on adjusted net income and earnings per share (EPS), but rebounded +2.21% today. Growth stocks broadly lagged in both Hong Kong and especially in Mainland China, after a sharp rotation from growth to value. Unlike other growth names, robotics stocks held up, as industry leader Unitree announced plans to IPO later this year, though without specifying the location, though it will likely be Hong Kong.
Stepping back, between yesterday and today, we saw Mainland indices meet a resistance level at near 3,900 for Shanghai and 2,500 for Shenzhen, with overbought readings flashing. A breather for these markets is healthy.
Market Snapshot (Monday vs. Today):
- Shanghai: -0.41% (yesterday +0.38%)
- Shenzhen: -2.0% (yesterday +0.79%)
- STAR Board: -2.09% (yesterday +1.10%)
- Hang Seng Index: -0.47% (yesterday +2.15%)
- HS Tech Index: -1.4% (yesterday +1.91%)
- Southbound Stock Connect net buying $1.53 billion (yesterday $1.55 billion)
- CNY was off versus the USD both days but not significantly.
The Shanghai market’s yield remains 2.39%, which is above the 10-Year China Government Bond's 1.82%. New brokerage account openings jumped 34.97% year-over-year (YoY) in August to 2.65 million, following July’s 165.2% YoY surge to 1.94 million. Year-to-date, that’s 17.21 million new accounts and a total of 240 million A-share brokerage accounts, which is especially notable next to Charles Schwab’s 37.4 million active US accounts. Retail investors continue to dominate A-share ownership at 58%, compared with 32% for financial professionals.
Meanwhile, Caixin has ended its sponsorship of the S&P Dow Jones China PMI series, replaced by Rating Dog. August’s Rating Dog China Manufacturing PMI rose to 50.5 (from July’s 49.5 and ahead of the 49.8 forecast). August electric vehicle (EV) and hybrid sales are expected to climb 24% YoY and 10% month-over-month to 1.3 million vehicles, according to the China Passenger Car Association (CPCA).
Tomorrow marks the 80th anniversary of the end of World War II, with a giant military parade planned; in Beijing. Contrary to some reports, President Trump will not attend.
A weekend ritual is tuning into Renaissance Macro’s "Ren Mac Off-Script" podcast, which delivers a concise recap of the week in markets, economics, and policy. This week’s episode featured the show’s first guest, Josh Brown, ahead of the Future Proof conference. Ren Mac’s market strategist Jeff deGraff discussed the China equity breakout with Josh, a trend he’s been highlighting for almost a year. The podcast is well worth a listen for insights into global market dynamics.
Last Night’s Performance
| Country / Index | Ticker | 1-Day Change |
|---|---|---|
| China (Hong Kong) | HSI Index | -0.5% |
| Hang Seng Tech | HSTECH Index | -1.2% |
| Hong Kong Turnover | HKTurn Index | -13.7% |
| Hong Kong Short Sale Turnover | HKSST Index | 0.8% |
| Short Turnover as a % of Hong Kong Turnover | N/A | 14.3% |
| Southbound Stock Connect Net Buy/Sell (US $ Millions) | N/A | 1,185.31 |
| China (Shanghai) | SHCOMP Index | -0.4% |
| China (Shenzhen) | SZCOMP Index | -2% |
| China (STAR Board) | Star50 Index | -2.1% |
| Mainland Turnover | .chturn Index | 4.5% |
| Northbound Stock Connect Net Buy/Sell (US $ Millions) | N/A | Not Available |
| Jing Daily China Global Luxury Index | CHINALUX Index | -0.3% |
| Japan | NKY Index | 0.3% |
| India | SENSEX Index | -0.3% |
| Indonesia | JCI Index | 0.8% |
| Malaysia | FBMKLCI Index | 0.1% |
| Pakistan | KSE100 Index | 0.7% |
| Philippines | PCOMP Index | -0.2% |
| South Korea | KOSPI Index | 0.9% |
| Taiwan | TWSE Index | -0.2% |
| Thailand | SET Index | 0.3% |
| Singapore | STI Index | 0.5% |
| Australia | AS51 Index | -0.3% |
| Vietnam | VNINDEX Index | Closed |
| Indicator | Hong Kong | Mainland |
|---|---|---|
| Today's Volume % of 1-Year Average | 144% | 185% |
| Advancing Stocks | 129 | 1051 |
| Declining Stocks | 357 | 3981 |
| Outperforming Factors | Large Caps, Dividend Yield, Value | Dividend Yield, Value, Low Volatility |
| Underperforming Factors | Liquidity, Momentum, Buybacks | Momentum, Liquidity, Growth |
| Top Sectors | Tech, Financials, Healthcare | Utilities, Energy, Financials |
| Bottom Sectors | Materials, Discretionary, Industrials | Tech, Real Estate, Materials |
| Top Subsectors | Banks, Auto, Household Appliances | Banking, Oil/Gas, Power |
| Bottom Subsectors | Semis, Media/Entertainment, Construction Materials | Communication Equipment, Internet, Electronic Components |
| Southbound Connect Buys | Alibaba, HK Tracker ETF (Very Large), Tencent (Moderate) | N/A |
| Southbound Connect Sells | Hua Hong Semis, SMIC (Large), Xiaomi (Moderate), Meituan (Small), UBTech (Tiny) | N/A |
| MSCI China All Shares Index | # of Stocks | Average 1-Day Change (%) |
|---|---|---|
| Hong Kong Listed | 152 | -0.52 |
| Communication Services | 9 | -1.07 |
| Consumer Discretionary | 28 | -1.25 |
| Consumer Staples | 13 | -0.67 |
| Energy | 6 | -0.3 |
| Financials | 24 | 0.76 |
| Health Care | 12 | 0.29 |
| Industrials | 21 | -1.17 |
| Information Technology | 10 | 1.46 |
| Materials | 10 | -1.55 |
| Real Estate | 7 | -1.03 |
| Utilities | 12 | -0.06 |
| Mainland China Listed | 395 | -1.02 |
| Communication Services | 7 | -1.02 |
| Consumer Discretionary | 29 | 0.2 |
| Consumer Staples | 24 | 0.04 |
| Energy | 13 | 0.69 |
| Financials | 64 | 0.32 |
| Health Care | 32 | -0.37 |
| Industrials | 61 | -0.71 |
| Information Technology | 90 | -4.23 |
| Materials | 54 | -1.08 |
| Real Estate | 6 | -1.25 |
| Utilities | 15 | 1.02 |
| US & Hong Kong Dually Listed | Ticker | 1-Day Change (%) |
|---|---|---|
| Tencent HK | 700 HK Equity | -0.7 |
| Alibaba HK | 9988 HK Equity | -1.8 |
| JD.com HK | 9618 HK Equity | -1.5 |
| NetEase HK | 9999 HK Equity | -0.8 |
| Yum China HK | 9987 HK Equity | 0.3 |
| Baozun HK | 9991 HK Equity | -1.2 |
| Baidu HK | 9888 HK Equity | -1.5 |
| Autohome HK | 2518 HK Equity | 0 |
| Bilibili HK | 9626 HK Equity | -3.2 |
| Trip.com HK | 9961 HK Equity | -1.1 |
| EDU HK | 9901 HK Equity | -0.2 |
| Xpeng HK | 9868 HK Equity | -2.8 |
| Weibo HK | 9898 HK Equity | -0.1 |
| Li Auto HK | 2015 HK Equity | -0.4 |
| Nio Auto HK | 9866 HK Equity | -3.6 |
| Zhihu HK | 2390 HK Equity | -1 |
| KE HK | 2423 HK Equity | 1 |
| Tencent Music Entertainment HK | 1698 HK Equity | -0.5 |
| Meituan HK | 3690 HK Equity | -1.8 |
| Hong Kong's Most Heavily Traded by Value | 1-Day Change (%) |
|---|---|
| ALIBABA GROUP HOLDING LTD | -1.8 |
| XIAOMI CORP-CLASS B | 3.4 |
| SEMICONDUCTOR MANUFACTURI-H | -4.6 |
| TENCENT HOLDINGS LTD | -0.7 |
| MEITUAN-CLASS B | -1.8 |
| BYD CO LTD-H | 2.2 |
| HUA HONG SEMICONDUCTOR LTD-H | -5.5 |
| UBTECH ROBOTICS CORP LTD-H | 5.2 |
| HORIZON ROBOTICS INC | 1.3 |
| KUAISHOU TECHNOLOGY | -2.5 |
| Shanghai and Shenzhen's Most Heavily Traded by Value | 1-Day Change (%) |
|---|---|
| VISUAL CHINA GROUP CO LTD-A | -4.1 |
| SHANTUI CONSTRUCTION MACHI-A | 0.1 |
| EOPTOLINK TECHNOLOGY INC L-A | -7.8 |
| ZHONGJI INNOLIGHT CO LTD-A | -5.4 |
| CAMBRICON TECHNOLOGIES-A | 2.2 |
| VICTORY GIANT TECHNOLOGY -A | 0 |
| EAST MONEY INFORMATION CO-A | -2.9 |
| CHINA NORTHERN RARE EARTH -A | -5.1 |
| FOXCONN INDUSTRIAL INTERNE-A | -3.1 |
| SUZHOU TFC OPTICAL COMMUNI-A | -10.3 |
Last Night’s Exchange Rates, Prices, & Yields
- CNY per USD 7.14 versus 7.13 Friday
- CNY per EUR 8.31 versus 8.32 Friday
- Yield on 10-Year Government Bond 1.82% versus 1.84% Friday
- Yield on 10-Year China Development Bank Bond 1.87% versus 1.88% Friday
- Copper Price +0.09%
- Steel Price -0.19%