Alibaba Shines On As Trade Talks Continue
6 Min. Read Time
Key News
Asian equities were mixed overnight, as Malaysia, Indonesia, and Vietnam outperformed while Japan was closed in observance of the Respect for the Aged Day holiday.
US–China trade talks entered their second day in Madrid, with TikTok receiving substantial Western media attention. President Trump announced he would speak with President Xi on Friday, hinting at a potential solution regarding TikTok and suggesting the possibility of a Trump–Xi summit.
Both governments continued to strengthen their positions: the US administration threatened further tariffs due to Chinese purchases of Russian oil and chip export curbs, while China responded by halting US soybean imports, tightening rare earth exports, and singling out Nvidia for anti-monopoly violations. Both sides attempted to turn these actions into strategic wins.
A prime example of the Chinese government’s “kill two birds with one stone” approach came in President Xi’s article in Qiushi magazine, emphasizing the development of China’s unified national market (i.e., domestic consumption). The article, which received significant coverage in Mainland Chinese news, outlined key priorities:
- “First, we must focus on rectifying the chaotic phenomenon of low-price, disorderly competition among enterprises.”
- “Second, we will focus on rectifying irregularities in government procurement and bidding. We will prioritize addressing prominent issues such as awarding the lowest bid, passing off inferior products as superior ones, and collusion.”
- “We will streamline the path from export to domestic sales.”
These initiatives appeared to respond to US criticism concerning China’s alleged “overcapacity” and lack of domestic consumption, further underscoring the importance of reaching a US trade agreement. Persistent weakness in China’s real estate sector added another incentive for a deal.
August economic data reported in Mainland media was described as “stable,” though real estate prices continued to decline. Despite lackluster data, both Hong Kong and Mainland markets managed modest gains today. According to the South China Morning Post, Mainland investors continued shifting a portion of bank deposits (1% yield) and fixed income investments (10-Year Treasury Bond: 1.87%) into stocks. The article cited August People’s Bank of China (PBOC) data showing RMB 1.17 trillion ($164.3 billion) moved to non-bank financial institutions after July’s RMB 2.15 trillion.
August economic data highlights included:
- New Home Prices: -0.3% (July: -0.31%)
- Used Home Prices: -0.58% (July: -0.55%)
- Retail Sales: +3.4% (July: +3.7%, Expected: +3.8%)
- Online Retail Sales Year-to-Date (YTD) YoY: +9.6%; 25% of physical goods sold online
- Industrial Production: +5.2% (July: +5.7%, Expected: +5.6%)
- Fixed Asset Investment: +0.5% (July: +1.6%, Expected: +1.5%)
- Property Investment: -12.9% (July: -12%, Expected: -12.5%)
- Residential Property Sales YTD YoY: -7% (July: -6.2%)
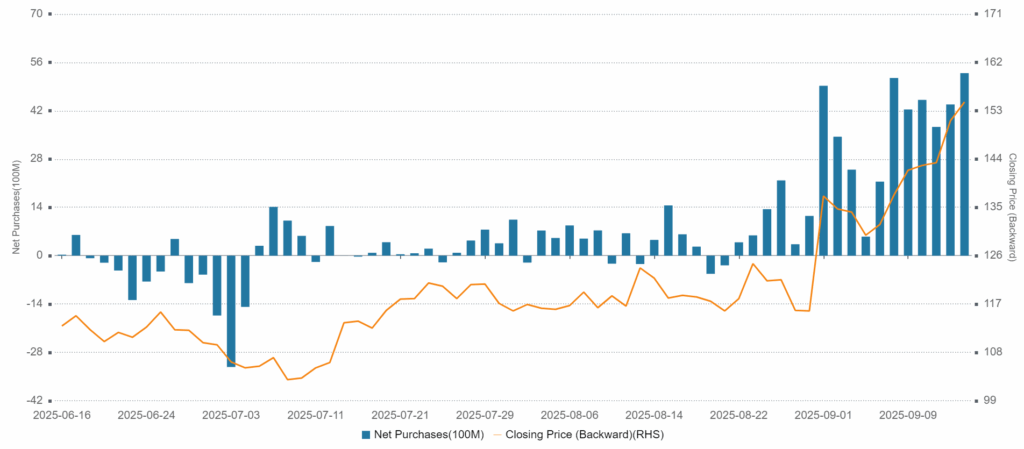
Both Hong Kong and Mainland China stocks were volatile but closed slightly higher on decent volumes, though market breadth was poor. Hong Kong growth stocks were led by Alibaba Group Holding Limited (+2.32%), which was the most heavily traded stock by value, fueled by another strong day of net buying via Southbound Stock Connect, the seventeenth consecutive net buy day and the largest since February 25.
Tencent Holdings Limited closed flat after announcing its first bond issuance in four years, with S&P Global reaffirming its A+ rating. CATL jumped +7.44% on a broker upgrade. BYD Company Limited (+3.44%), Li Auto Inc. (+4.56%), and Nio Inc. (+3.53%) also advanced. Banks, brokerage firms, and insurance stocks declined, along with Pop Mart International Group Limited (-6.43%) and Baidu Inc. (-2.43%). The seven remaining Hong Kong-listed real estate stocks included in the MSCI China Index fell due to weak real estate data.
Mainland China mirrored Hong Kong's intra-day volatility, closing slightly higher as growth stocks outperformed despite a majority of decliners led by financials. Shanghai and Shenzhen Composite Indices reached the top of recent ranges, encountering resistance.
Friday I failed to provide the August M2, new yuan loan and aggregate financing data as it didn’t appear to be a market mover. New loans YTD increased to RMB 13.46T from July’s RMB 12.87T though missing economist expectations of RMB 13.57T. Aggregate financing YTD increased to RMB 26.56T from July’s RMB 23.99 which beat economist expectations of RMB 26.487T. M2 increased in August 8.8% which was the same as July and beat economists’ 8.6%. I really don’t think the data was a factor on Friday but regardless here it is.
Alibaba Hong Kong Stock Price and Net Inflow From Mainland Investors via Southbound Stock Connect:
Last Night's Performance
| Country / Index | Ticker | 1-Day Change |
|---|---|---|
| China (Hong Kong) | HSI Index | 0.2% |
| Hang Seng Tech | HSTECH Index | 0.9% |
| Hong Kong Turnover | HKTurn Index | -9.5% |
| Hong Kong Short Sale Turnover | HKSST Index | -2.9% |
| Short Turnover as a % of Hong Kong Turnover | N/A | 14.8% |
| Southbound Stock Connect Net Buy/Sell (US $ Millions) | N/A | 0 |
| China (Shanghai) | SHCOMP Index | -0.3% |
| China (Shenzhen) | SZCOMP Index | 0.4% |
| China (STAR Board) | Star50 Index | 0.2% |
| Mainland Turnover | .chturn Index | -9.6% |
| Northbound Stock Connect Net Buy/Sell (US $ Millions) | N/A | Not Available |
| Jing Daily China Global Luxury Index | CHINALUX Index | 0.4% |
| Japan | NKY Index | 0.9% |
| India | SENSEX Index | -0.1% |
| Indonesia | JCI Index | 1.1% |
| Malaysia | FBMKLCI Index | 1.1% |
| Pakistan | KSE100 Index | 0.6% |
| Philippines | PCOMP Index | -0.8% |
| South Korea | KOSPI Index | 0.3% |
| Taiwan | TWSE Index | -0.5% |
| Thailand | SET Index | 0.5% |
| Singapore | STI Index | -0.1% |
| Australia | AS51 Index | -0.1% |
| Vietnam | VNINDEX Index | 1.1% |
| Indicator | Hong Kong | Mainland |
|---|---|---|
| Today's Volume % of 1-Year Average | 123% | 140% |
| Advancing Stocks | 170 | 1678 |
| Declining Stocks | 315 | 3303 |
| Outperforming Factors | Quality, Momentum, Buyback | Liquidity, Growth, Buyback |
| Underperforming Factors | Value, Dividend Yield, Multi-Factor Score | Multi-Factor Score, EPS Revision, Dividend Yield |
| Top Sectors | Discretionary, Energy, Tech | Industrials, Energy, Communication |
| Bottom Sectors | Real Estate, Financials, Utilities | Financials, Tech, Materials |
| Top Subsectors | Electrical Equipment, Pharmaceuticals, Coal | Electrical Power Grid, Auto, Leisure Products |
| Bottom Subsectors | Consumer Durables/Apparel, Paper/Packaging, Construction Materials | Comprehensive, Soft Drink, Motorcycle |
| Southbound Connect Buys | Alibaba (Very Large), HK Tracker ETF (Large) Meituan (Moderate), SMIC, Transthera (Small) | |
| Southbound Connect Sells | Pop Mart, Xiaomi (Moderate), Tencent (Small) |
| MSCI China All Shares Index | # of Stocks | Average 1-Day Change (%) |
|---|---|---|
| Hong Kong Listed | 152 | 0.28 |
| Communication Services | 9 | 0.13 |
| Consumer Discretionary | 28 | 1.36 |
| Consumer Staples | 13 | 0.74 |
| Energy | 6 | 1.15 |
| Financials | 24 | -1.2 |
| Health Care | 12 | 0.5 |
| Industrials | 21 | -0.13 |
| Information Technology | 10 | 0.79 |
| Materials | 10 | -0.93 |
| Real Estate | 7 | -1.82 |
| Utilities | 12 | -1.02 |
| Mainland China Listed | 395 | 0.2 |
| Communication Services | 7 | 1.58 |
| Consumer Discretionary | 29 | 1.37 |
| Consumer Staples | 24 | 0.24 |
| Energy | 13 | 1.71 |
| Financials | 64 | -0.63 |
| Health Care | 32 | -0.05 |
| Industrials | 61 | 2.11 |
| Information Technology | 90 | -0.48 |
| Materials | 54 | -0.37 |
| Real Estate | 6 | 0.7 |
| Utilities | 15 | -0.29 |
| US & Hong Kong Dually Listed | Ticker | 1-Day Change (%) |
|---|---|---|
| Tencent HK | 700 HK Equity | 0 |
| Alibaba HK | 9988 HK Equity | 2.3 |
| JD.com HK | 9618 HK Equity | 0 |
| NetEase HK | 9999 HK Equity | 1.8 |
| Yum China HK | 9987 HK Equity | -2.7 |
| Baozun HK | 9991 HK Equity | -3.2 |
| Baidu HK | 9888 HK Equity | -2.4 |
| Autohome HK | 2518 HK Equity | 0 |
| Bilibili HK | 9626 HK Equity | 4.9 |
| Trip.com HK | 9961 HK Equity | -0.6 |
| EDU HK | 9901 HK Equity | 0.6 |
| Xpeng HK | 9868 HK Equity | 1.6 |
| Weibo HK | 9898 HK Equity | 1.6 |
| Li Auto HK | 2015 HK Equity | 4.6 |
| Nio Auto HK | 9866 HK Equity | 3.5 |
| Zhihu HK | 2390 HK Equity | 0.3 |
| KE HK | 2423 HK Equity | -2.7 |
| Tencent Music Entertainment HK | 1698 HK Equity | -1.1 |
| Meituan HK | 3690 HK Equity | 0.8 |
| Hong Kong's Most Heavily Traded by Value | 1-Day Change (%) |
|---|---|
| ALIBABA GROUP HOLDING LTD | 2.3 |
| TENCENT HOLDINGS LTD | 0 |
| POP MART INTERNATIONAL GROUP | -6.4 |
| XIAOMI CORP-CLASS B | 1.9 |
| BYD CO LTD-H | 3.4 |
| MEITUAN-CLASS B | 0.8 |
| SEMICONDUCTOR MANUFACTURI-H | 0.4 |
| TRANSTHERA SCIENCES NANJIN-H | 115.6 |
| BAIDU INC-CLASS A | -2.4 |
| SENSETIME GROUP INC-CLASS B | -0.4 |
| Shanghai and Shenzhen's Most Heavily Traded by Value | 1-Day Change (%) |
|---|---|
| CONTEMPORARY AMPEREX TECHN-A | 9.1 |
| SUNGROW POWER SUPPLY CO LT-A | 2.1 |
| CAMBRICON TECHNOLOGIES-A | -3.2 |
| VICTORY GIANT TECHNOLOGY -A | -3 |
| HYGON INFORMATION TECHNOLO-A | 5.2 |
| ZHONGJI INNOLIGHT CO LTD-A | -3.3 |
| LUXSHARE PRECISION INDUSTR-A | 0.1 |
| WOLONG ELECTRIC GROUP CO L-A | 0.1 |
| EOPTOLINK TECHNOLOGY INC L-A | -2.1 |
| EAST MONEY INFORMATION CO-A | 1 |
Last Night's Exchange Rates, Prices, & Yields
- CNY per USD 7.12 versus 7.12 Friday
- CNY per EUR 8.37 versus 8.35 Friday
- Yield on 10-Year Government Bond 1.87% versus 1.87% Friday
- Yield on 10-Year China Development Bank Bond 1.95% versus 1.94% Friday
- Copper Price +0.21%
- Steel Price +0.64%