Mainland Markets Reopen In Good Spirits, Reaching Decade High
5 Min. Read Time
Key News
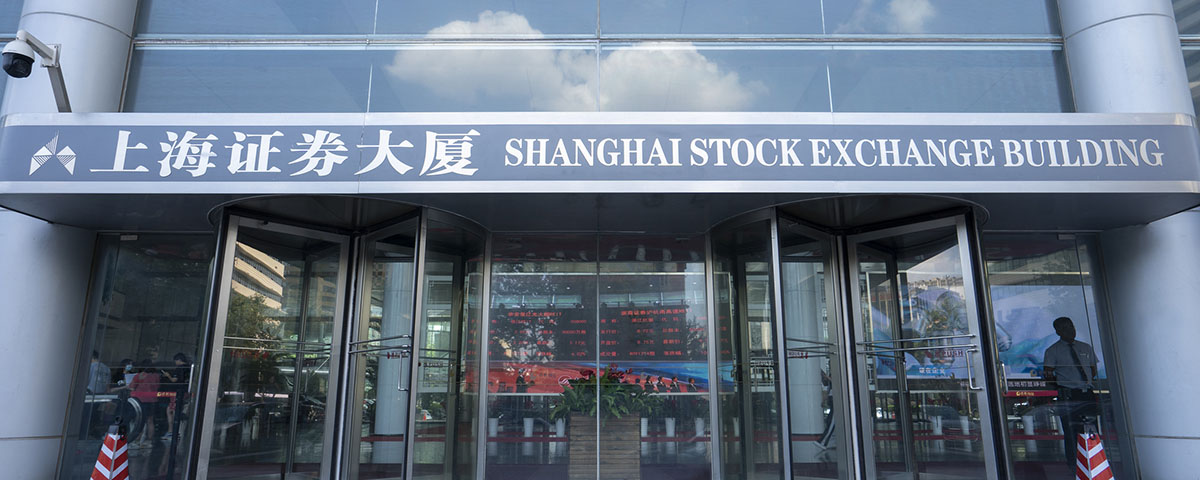
Asian equities mostly followed Wall Street higher overnight as Mainland China's STAR Market and Korea outperformed, while the Philippines and Hong Kong's Hang Seng Tech Index underperformed. Mainland China's markets reopened for the first time since September 30th, concluding the "Golden Week" national holiday and catching up with gains offshore.
Upon reopening, the Shanghai Composite climbed to its highest level in over a decade, led by mining stocks and precious metals on new export controls and gold reaching record highs. This was the first market session in a month with major political events on the docket, including meetings between China's leadership in Beijing and a potential meeting between Presidents Trump and Xi on the sidelines of the APEC summit. The market appears to be hoping for good outcomes based on the Mainland's rise upon reopening, though there were other catalysts, too.
Growth stocks were mixed overnight, as were internet stocks. Alibaba fell -2.4%, while Trip.com gained +1.8% on positive travel data from the holiday week, discussed below. Video platform Bilibili gained +6.7% on strong growth and increased share buybacks. Tencent Music Entertainment was also a top-performer, continuing this year's trend of video platforms outperforming E-Commerce giants within the internet sector.
During the week-long national holiday, China's domestic tourism increased 15.9% from last year, based on over 800 million individual trips, according to data from Wind. Total tourism spending increased 15.3% from last year, reaching over $100 billion. Cross-border travel was also on the rise, increasing 6.3% from last year.
The Fourth Plenary Session of the 20th Central Committee is focusing on drafting the "15th Five-Year Plan" this month. According to a large investment bank, the A-share market is expected to enter a critical period, which will include a recovery in market risk appetite and liquidity, as a result.
Battery names benefited from breakthroughs in solid-state battery technology, as China-based researchers published new research in international journals. CATL gained +2.0%.
Southbound Stock Connect flow was lighter than expected, considering that the channel was closed for an entire week. Nonetheless, net flow was positive at nearly $400 million. Interestingly, Hong Kong's volume remained high, even without a significant southbound inflow, based on the one-year average. Perhaps that means that more foreign investors and traders are getting involved?
Hang Seng Bank gained +26% on a privatization offer from HSBC.
| Country / Index | Ticker | 1-Day Change |
|---|---|---|
| China (Hong Kong) | HSI Index | -0.3% |
| Hang Seng Tech | HSTECH Index | -0.7% |
| Hong Kong Turnover | HKTurn Index | 122.6% |
| Hong Kong Short Sale Turnover | HKSST Index | 54.6% |
| Short Turnover as a % of Hong Kong Turnover | N/A | 11.8% |
| Southbound Stock Connect Net Buy/Sell (US $ Millions) | N/A | 388.67 |
| China (Shanghai) | SHCOMP Index | 1.3% |
| China (Shenzhen) | SZCOMP Index | 1.2% |
| China (STAR Board) | Star50 Index | 2.9% |
| Mainland Turnover | .chturn Index | 21.7% |
| Northbound Stock Connect Net Buy/Sell (US $ Millions) | N/A | Not Available |
| Jing Daily China Global Luxury Index | CHINALUX Index | -0.2% |
| Japan | NKY Index | 1.8% |
| India | SENSEX Index | 0.5% |
| Indonesia | JCI Index | 1% |
| Malaysia | FBMKLCI Index | 0.1% |
| Pakistan | KSE100 Index | -0.4% |
| Philippines | PCOMP Index | -0.7% |
| South Korea | KOSPI Index | 2.7% |
| Taiwan | TWSE Index | 0.9% |
| Thailand | SET Index | 0.7% |
| Singapore | STI Index | -0.4% |
| Australia | AS51 Index | 0.2% |
| Vietnam | VNINDEX Index | 1.1% |
| Indicator | Hong Kong | Mainland China |
|---|---|---|
| Today's Volume as % of 1-Year Average | 164 | 159 |
| Advancing Stocks | 62 (Hang Seng) | 216 (CSI 300) |
| Declining Stocks | 26 (Hang Seng) | 78 (CSI 300) |
| Outperforming Factors | Value | Value |
| Underperforming Factors | Growth | Growth |
| Top Sectors | Materials, Utilities, Industrials | Materials, Utilities, Information Technology |
| Bottom Sectors | Health Care, Communication Discretionary, Consumer Staples | Real Estate, Communication Services, Consumer Discretionary |
| Top Subsectors | Building, Non-Ferrous Metals, Construction Materials | Precious Metals, Base Metals, Power Generation |
| Bottom Subsectors | Semiconductors, Pharmaceuticals, Consumer Staples | Tourism, Cultural Media, Real Estate |
| Southbound Connect Buys | Kuaishou, ZTE, Xiaomi | N/A |
| Southbound Connect Sells | SMIC, Hua Hong Semiconductor, Alibaba | N/A |
| MSCI China All Shares Index | # of Stocks | Average 1-Day Change (%) |
|---|---|---|
| Hong Kong Listed | 151 | -0.07 |
| Communication Services | 9 | 0.3 |
| Consumer Discretionary | 28 | -1.02 |
| Consumer Staples | 13 | -0.4 |
| Energy | 7 | 1.87 |
| Financials | 23 | 1.07 |
| Health Care | 13 | -5.42 |
| Industrials | 20 | 2.81 |
| Information Technology | 10 | -0.2 |
| Materials | 10 | 4.34 |
| Real Estate | 6 | 0.93 |
| Utilities | 12 | 3 |
| Mainland China Listed | 404 | 1.46 |
| Communication Services | 6 | -2.2 |
| Consumer Discretionary | 31 | -0.78 |
| Consumer Staples | 24 | -0.47 |
| Energy | 13 | 1.61 |
| Financials | 64 | 0.04 |
| Health Care | 31 | 0.12 |
| Industrials | 64 | 2.12 |
| Information Technology | 91 | 2.45 |
| Materials | 58 | 5.99 |
| Real Estate | 6 | -2.72 |
| Utilities | 16 | 2.61 |
| US & Hong Kong Dually Listed | Ticker | 1-Day Change (%) |
|---|---|---|
| Tencent HK | 700 HK Equity | 0.1 |
| Alibaba HK | 9988 HK Equity | -2.4 |
| JD.com HK | 9618 HK Equity | 0.1 |
| NetEase HK | 9999 HK Equity | 0.3 |
| Yum China HK | 9987 HK Equity | 0.9 |
| Baozun HK | 9991 HK Equity | -0.4 |
| Baidu HK | 9888 HK Equity | -1.1 |
| Autohome HK | 2518 HK Equity | -1.5 |
| Bilibili HK | 9626 HK Equity | 6.7 |
| Trip.com HK | 9961 HK Equity | 1.8 |
| EDU HK | 9901 HK Equity | 2 |
| Xpeng HK | 9868 HK Equity | -1.4 |
| Weibo HK | 9898 HK Equity | 0.2 |
| Li Auto HK | 2015 HK Equity | -0.9 |
| Nio Auto HK | 9866 HK Equity | 1.3 |
| Zhihu HK | 2390 HK Equity | 1.2 |
| KE HK | 2423 HK Equity | 0 |
| Tencent Music Entertainment HK | 1698 HK Equity | 1.5 |
| Meituan HK | 3690 HK Equity | -0.1 |
| Hong Kong's Most Heavily Traded by Value | 1-Day Change (%) |
|---|---|
| ALIBABA GROUP HOLDING LTD | -2.4 |
| SEMICONDUCTOR MANUFACTURI-H | -6.7 |
| HUA HONG SEMICONDUCTOR LTD-H | -6.4 |
| TENCENT HOLDINGS LTD | 0.1 |
| HSBC HOLDINGS PLC | -6 |
| HANG SENG BANK LTD | 25.9 |
| XIAOMI CORP-CLASS B | -0.9 |
| KUAISHOU TECHNOLOGY | 3.6 |
| XTALPI HOLDINGS LTD | -13.9 |
| ZIJIN MINING GROUP CO LTD-H | 5.4 |
| Shanghai and Shenzhen's Most Heavily Traded by Value | 1-Day Change (%) |
|---|---|
| SEMICONDUCTOR MANUFACTURIN-A | -0.9 |
| ZTE CORP-A | 9.5 |
| EOPTOLINK TECHNOLOGY INC L-A | -4 |
| CHINA NORTHERN RARE EARTH -A | 10 |
| LUXSHARE PRECISION INDUSTR-A | 0.9 |
| CONTEMPORARY AMPEREX TECHN-A | 2 |
| EAST MONEY INFORMATION CO-A | -1.3 |
| CAMBRICON TECHNOLOGIES-A | 0.6 |
| ZHONGJI INNOLIGHT CO LTD-A | -1.2 |
| ZIJIN MINING GROUP CO LTD-A | 10 |
Last Night's Exchange Rates, Prices, & Yields
- CNY per USD 7.12 versus 7.12 on 9/30
- CNY per EUR 8.27 versus 8.27 yesterday
- Yield on 10-Year Government Bond 1.85% versus 1.86% on 9/30
- Yield on 10-Year China Development Bank Bond 1.97% versus 1.98% on 9/30
- Copper Price 4.19%
- Steel Price 0.19%