Sell Off From Iran Conflict Continues
7 Min. Read Time
Key News
Asian equities sold off sharply amid Middle East tensions, the knock-on effects of higher oil and liquid natural gas (LNG) prices, concerns over oil supply, and a stronger US dollar.
South Korea took the brunt of the downdraft after reopening from its holiday yesterday, while India was closed for Holi, the festival of colors, and Thailand was closed for Makha Bucha Day, an important Buddhist holiday.
Growth stocks also took the brunt of the downdraft in Hong Kong and Mainland China, as non-ferrous metal stocks were hit hard by lower gold price. Meanwhile, banks, oil & gas, and shipping stocks outperformed on higher prices. Hong Kong-listed internet stocks were not off too badly, though technology hardware, semiconductors, autos, and healthcare all underperformed. Mainland investors bought the dip in Hong Kong via Southbound Stock Connect, to the tune of a net $779 million.
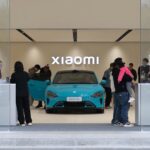
The Hong Kong Tracker ETF was a large net buy overnight. Meanwhile, Tencent fell -0.68% and was today’s volume leader by value of shares traded and had a large call option trade. JD.com fell -0.89% and had several large put trades on the tape. Alibaba fell -1.17% following another net sell day from Mainland investors via the Southbound Stock Connect, despite the company’s Qwen AI large language model (LLM) saw its monthly active users increased by +552% to 203 million in 2025 and announcement that its Qoder Work AI desktop agent will be compatible with both Apple and Microsoft computers. Elon Musk noted on X that Qwen’s performance was “astonishing”.
AI LLM provider MiniMax gained +9.1% after yesterday’s post close Q3 results that beat analyst expectations. Revenue increased +158% to $790 million year-over-year (YoY), though its net loss grew to $1.87 billion from $465 million.
NetEase gained +1.41%, as its Hong Kong listing volume reached 55% of its ADR volume, which makes it eligible for the Southbound Stock. This is a very positive catalyst for the stock, in my opinion.
Mainland was very similar to Hong Kong as technology hardware, semiconductors, non-ferrous metals, and defense stocks all underperformed. Meanwhile, banks, insurance, and oil & gas stocks were all higher. These sectors all weighed on the STAR Board, which underperformed. The ETFs favored by the National Team had below-average volumes. Today’s move sent both the Shanghai and Shenzhen back toward the lower end of their range as they had approached resistance. The "Dual Sessions" important policy meetings will kick off tomorrow, as the CCPPCC will run until March 11th. Meanwhile, the National People’s Congress will start on Thursday. Areas of emphasis include “shift in policy priorities toward technological self-reliance, energy security, and domestic demand stimulation.” There is talk that the NDRC and MoF will focus policy support toward “semiconductors, new energy, and advanced manufacturing.”
Treasury Secretary Bessent, US Trade Representative Jamison Greer, and Vice Premier He Lifeng will meet in Paris next week. Media reports say China will increase purchases of US soybeans and Boeing aircraft, while the US could lower fentanyl tariffs. We believe a broader deal could involve Chinese companies partnering with or forming joint ventures with other Chinese companies to manufacture in the United States. Because the trade war is a good trade war, the US is the #1 exporter of services globally (computer software, lawyers, investment bankers, accountants, movies, etc). What goods (tangible products) do the ordinary Chinese people want that the US makes? It ain’t a Ford F-150! This is an issue for India, Korea, Japan, etc, which is why they are looking to invest in the US. Non-consensus view, but we believe this could occur with China as well, no different than TSMC being forced to build a factory in Arizona or European, Japanese, and Korean companies building autos in the US.
I have spent the last several days trying to understand the weakness in offshore Chinese equities that began back in October. Up until today, Mainland China (Shanghai, Shenzhen, and STAR Board), which is predominantly owned by investors in China, had significantly outperformed offshore China, which is predominantly held by foreign investors (86% of MSCI China is offshore China). Obviously, the Iran and Middle East conflict has been risk-off recently, as investors shift to capital preservation mode. In speaking with a host of contacts who ply their wares in our space, my thesis was that Samsung, SK Hynix, and TSMC have hoovered up all the Asia tech investment flows, as investors favor AI picks and shovels over those that incorporate AI. This view was widely agreed upon, though other factors were cited, including:
- China's Q4 economic data was lackluster.
- Domestic consumption remains tepid.
- U.S.-China geopolitical tensions have not yet subsided completely.
- There are lingering concerns about China's regulatory interference, as seen recently with SAMR’s Trip.com inquiry.
- Alibaba’s AI capital expenditures and instant commerce subsidies to counter JD.com and Meituan have weighed on results.
- There are fewer active long-only emerging-market managers following a 17-year US bull market and the US not accounting for 2/3 of global market capitalization. One of the largest EM funds in the US has seen assets drop from $53 billion in May of 2021 to only $9.3 billion today! When money does go to the EM space, it is increasingly passive, which means it flows to the largest companies and those companies whose market capitalization is growing, i.e., those with momentum.
The above explanation does not make the downdraft any less painful. At the same time, the space is oversold, and the hot money has clearly left the building, with positioning at rock bottom levels. These tend to be the ingredients for a rally. I am keeping my fingers and toes crossed!
Last Night's Performance
| Country / Index | Ticker | 1-Day Change |
|---|---|---|
| China (Hong Kong) | HSI Index | -1.1% |
| Hang Seng Tech | HSTECH Index | -2.3% |
| Hong Kong Turnover | HKTurn Index | 3.6% |
| Hong Kong Short Sale Turnover | HKSST Index | -20.7% |
| Short Turnover as a % of Hong Kong Turnover | N/A | 18.5% |
| Southbound Stock Connect Net Buy/Sell (US $ Millions) | N/A | 776.66 |
| China (Shanghai) | SHCOMP Index | -1.4% |
| China (Shenzhen) | SZCOMP Index | -3.2% |
| China (STAR Board) | Star50 Index | -5.2% |
| Mainland Turnover | .chturn Index | 3.6% |
| Japan | NKY Index | -3.1% |
| India | SENSEX Index | -1.3% |
| Indonesia | JCI Index | -1% |
| Malaysia | FBMKLCI Index | 0.7% |
| Pakistan | KSE100 Index | 4.2% |
| Philippines | PCOMP Index | 0.3% |
| South Korea | KOSPI Index | -7.2% |
| Taiwan | TWSE Index | -2.2% |
| Thailand | SET Index | -4% |
| Singapore | STI Index | 0.5% |
| Australia | AS51 Index | -1.3% |
| Vietnam | VNINDEX Index | -1.8% |
| Indicator | Hong Kong | Mainland China |
|---|---|---|
| Today's Volume % of 1-Year Average | 144% | 166% |
| Advancing Stocks | 86 | 549 |
| Declining Stocks | 411 | 4583 |
| Outperforming Factors | Low Volatility, Dividend Yield | Value, Dividend Yield, Low Volatility |
| Underperforming Factors | EPS Revision, Liquidity, Momentum | Liquidity, Momentum, Growth |
| Top Sectors | Energy, Financials, Utilities | Energy, Utilities, Financials |
| Bottom Sectors | Materials, Tech, Healthcare | Tech, Materials, Communication |
| Top Subsectors | Petroleum, Equity REITs, Utilities | Oil/Gas, Gas, Marine |
| Bottom Subsectors | National Defense, Non Ferrous Metal, Machinery | Aerospace/Military, Internet, Chemical Fiber |
| Southbound Connect Buys | Tencent, HK Tracker ETF (Very Large), HS Tech ETF (Large), Sinopec, Xiaomi (Moderate), Dzug, Shandong Molong (Small) | N/A |
| Southbound Connect Sells | Alibaba (Large), SMIC (Small) | N/A |
| MSCI China All Shares Index | # of Stocks | Average 1-Day Change (%) |
|---|---|---|
| Hong Kong Listed | 165 | -1.27 |
| Communication Services | 11 | -0.31 |
| Consumer Discretionary | 28 | -1.8 |
| Consumer Staples | 13 | -1.81 |
| Energy | 6 | 1.24 |
| Financials | 25 | 0.83 |
| Health Care | 16 | -3.17 |
| Industrials | 22 | -2.06 |
| Information Technology | 12 | -4.25 |
| Materials | 14 | -6.09 |
| Real Estate | 7 | -1.36 |
| Utilities | 11 | 0.67 |
| Mainland China Listed | 386 | -2.16 |
| Communication Services | 8 | -3.97 |
| Consumer Discretionary | 26 | -2.56 |
| Consumer Staples | 19 | -0.78 |
| Energy | 12 | 5.29 |
| Financials | 64 | 0.16 |
| Health Care | 31 | -1.87 |
| Industrials | 58 | -1.94 |
| Information Technology | 95 | -4.54 |
| Materials | 52 | -4.29 |
| US & Hong Kong Dually Listed | Ticker | 1-Day Change (%) |
|---|---|---|
| Tencent HK | 700 HK Equity | -0.7 |
| Alibaba HK | 9988 HK Equity | -1.2 |
| JD.com HK | 9618 HK Equity | -0.9 |
| NetEase HK | 9999 HK Equity | 1.4 |
| Yum China HK | 9987 HK Equity | -2.6 |
| Baozun HK | 9991 HK Equity | -2.1 |
| Baidu HK | 9888 HK Equity | -1 |
| Autohome HK | 2518 HK Equity | -0.3 |
| Bilibili HK | 9626 HK Equity | -0.7 |
| Trip.com HK | 9961 HK Equity | -3.2 |
| EDU HK | 9901 HK Equity | -3.5 |
| Xpeng HK | 9868 HK Equity | -5.7 |
| Weibo HK | 9898 HK Equity | -1.3 |
| Li Auto HK | 2015 HK Equity | -2.1 |
| Nio Auto HK | 9866 HK Equity | -4.9 |
| Zhihu HK | 2390 HK Equity | -1.9 |
| KE HK | 2423 HK Equity | 0.3 |
| Tencent Music Entertainment HK | 1698 HK Equity | 0.4 |
| Meituan HK | 3690 HK Equity | -2.3 |
| Hong Kong's Most Heavily Traded by Value | 1-Day Change (%) |
|---|---|
| TENCENT HOLDINGS LTD | -0.7 |
| ALIBABA GROUP HOLDING LTD | -1.2 |
| CNOOC LTD-H | 3.2 |
| SHANDONG MOLONG PETROLEUM-H | 26.1 |
| XIAOMI CORP-CLASS B | -4.7 |
| SHANGHAI DAZHONG PUBLIC UT-H | 61.8 |
| SEMICONDUCTOR MANUFACTURI-H | -3.2 |
| PETROCHINA CO LTD-H | 5 |
| MEITUAN-CLASS B | -2.3 |
| SINOPEC OILFIELD SERVICE -H | 13.4 |
| Shanghai and Shenzhen's Most Heavily Traded by Value | 1-Day Change (%) |
|---|---|
| ZHONGJI INNOLIGHT CO LTD-A | -1.2 |
| EOPTOLINK TECHNOLOGY INC L-A | 0.3 |
| ZIJIN MINING GROUP CO LTD-A | -4.7 |
| SUZHOU TFC OPTICAL COMMUNI-A | -4.4 |
| FIBERHOME TELECOM TECH CO-A | -1 |
| CONTEMPORARY AMPEREX TECHN-A | 1.1 |
| VICTORY GIANT TECHNOLOGY -A | -6.4 |
| HGTECH CO LTD-A | 0.9 |
| CHINA NORTHERN RARE EARTH -A | -9.9 |
| SUNGROW POWER SUPPLY CO LT-A | 0.7 |
Last Night's Exchange Rates, Prices, & Yields
- CNY per USD 6.90 versus 6.90 yesterday
- CNY per EUR 8.00 versus 8.07 yesterday
- Yield on 10-Year Government Bond 1.78% versus 1.78% yesterday
- Yield on 10-Year China Development Bank Bond 1.94% versus 1.94% yesterday
- Copper Price -1.10%
- Steel Price -0.16%