

Contrarians, Where Art Thou?
7 Min. Read Time
Week in Review
- Asian equities were mixed but mostly lower for the week, as Korea and Japan outperformed, while Hong Kong and Vietnam underperformed.
- JD.com and Tencent both reported Q2 earnings results this week: JD reported improving profitability as the instant commerce price wars subside, while Tencent significantly stepped up its spending on AI compute.
- China reported its July consumer price index (CPI) this week, which showed inflation, though at a slower rate than expected.
- Mainland investors were active this week in Hong Kong, with strong net purchases of the dip in Tencent's shares on its bottom line miss, though their activity was not sufficient to stem the decline entirely.
Friday's Key News
Asian equities ended the week mixed on light summer volumes, as Japan, Korea, and Taiwan were lifted by the AI supply chain trade rebound, though onshore China’s Science and Technology (STAR) Board was off a touch for the week, while Pakistan was closed for Independence Day.
Hong Kong ended the week with a thud, though volumes were very light. Although the US' China drone ban made front page news, the policy is likely more of a “The Art of the Deal” before the Trump-Xi meeting in September.
JD.com was crushed -10.41%. Investors are focusing on the first quarterly revenue decline since going public, despite management saying the decline is likely a one off. Investors are also ignoring their large stock buyback and strong net income and earnings per share (EPS) rebound. JD’s volume today was 37 million shares versus yesterday’s 9 million shares and the 1-year average of 12 million.
JD’s results weighed on e-commerce rival Meituan, which fell -4.44%, and internet names, including Tencent, which fell -0.23% despite $141 million (HKD 1.11 billion) worth of net buying from Mainland investors via Southbound Stock Connect, Baidu, which fell -2.14%, and Trip.com, which fell -4.44%. Alibaba fell -1.64% as Mainland investors sold a net $135 million (HKD 1.1 billion) via Southbound Stock Connect today. Alibaba, which reports next Thursday, today has 10.28% of its Hong Kong-listed shares held by Mainland investors via Stock Connect versus the high of 11.27% in October of last year. Bloomberg is reporting that Alibaba will sell its video game unit for $1.5 billion. It would be great if they paid out the proceeds of the sale as a dividend or used it to buy back more shares.
Banks and insurance were lower, along with pharmaceuticals. Semiconductors were split, as foundry SMIC gained +4.81% on strong results, though peer Hua Hong Semiconductor fell -11.55% in Hong Kong and -8.57% in Mainland China on a very minor net income miss ($38.6 million versus expectations of $39.4 million) despite revenue growth of +27% year-over-year (YoY). Hua Hong was up nearly 100% in Hong Kong and more than that in Mainland China. Mainland-listed AI supply chain names were higher, as ChangXin Memory Technology (CXMT) gained +4.35. Meanwhile, technology hardware and communication equipment were higher.
There has been a lot of media attention on CXMT being China’s largest market cap company and larger than Alibaba and Tencent. The argument is highly flawed, as it focuses on total market cap of RMB 3.5 trillion, though only 6.73% of its shares are unrestricted, i.e. float freely. CXMT’s free float market cap is therefore only RMB 238 billion ($35 billion) versus Tencent’s free float market cap of $510 billion and Alibaba’s $292 billion.
Cambricon fell -1.13%, which weighed on the STAR Board, which was flat today.
Mainland-listed oil & gas were higher on Middle East tensions. Meanwhile, non-ferrous metals rebounded. The July economic data release was not a market mover. It was a quiet day overall!
July Economic Release Highlights:
- Aggregate Financing year-to-date (YTD) RMB 22.25 trillion versus June’s RMB 20.84 trillion and expectations of RMB 21.92 trillion
- New Loan YTD RMB 10.38 trillion versus June’s RMB 10.72 trillion and expectations of RMB 10.62 trillion
- M2 year-over-year (YoY) +7.7% versus June’s +8.0% and expectations of +7.9%
Back and revitalized following my Asia trip and family vacation, this week’s price action has been brutal. Yes, it’s the summer, i.e., quiet, but the circular logic of the US echochamber is a bit interesting to me. Yes, I see the great US EPS growth as well, I’m just saying positioning seems a touch crowded. Nonetheless, that does not mean the US market can’t go higher.
Below are three reasons why I believe China is a contratrian trade right now:
- Did anyone else notice China’s Treasury bond curve steepening? Commentary everywhere is about sovereign bonds rising, but nobody is talking about yields dropping in China. (I’ll put the chart up on X/Twitter)
- Did anyone else notice CNY’s strength versus the US dollar?
- Has anyone talked about how the largest US-listed South Korea ETF has AUM of $28 billion compared to the total value of the 32 US-listed China equity ETFs (plain vanilla ETFs, i.e., no leverage/inverse, swap, derivative based), which is $21 billion?
Contrarians, where art thou?
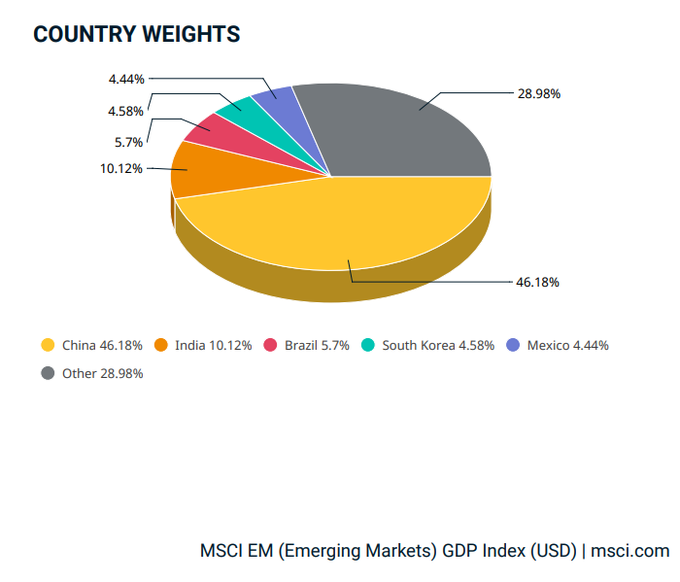
MSCI Emerging Markets GDP-Weighted Index:
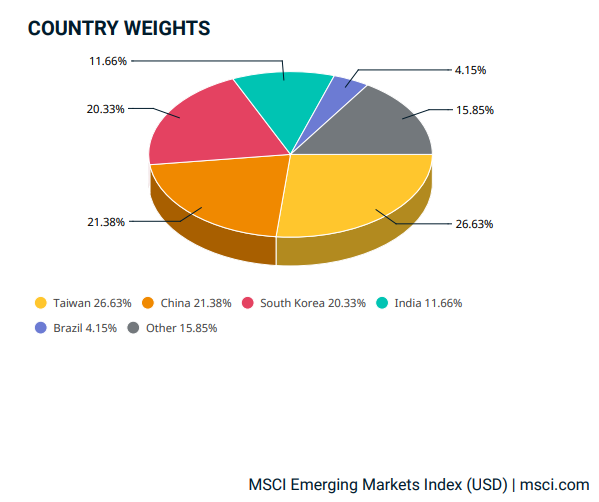
MSCI Emerging Markets Index:
Last Night's Performance
| Country / Index | Ticker | 1-Day Change |
|---|---|---|
| China (Hong Kong) | HSI Index | -1.1% |
| Hang Seng Tech | HSTECH Index | -1.8% |
| Hong Kong Turnover | HKTurn Index | -3.6% |
| Hong Kong Short Sale Turnover | HKSST Index | -10.6% |
| Short Turnover as a % of Hong Kong Turnover | N/A | 0.2 |
| Southbound Stock Connect Net Buy/Sell (US $ Millions) | N/A | -168.07 |
| China (Shanghai) | SHCOMP Index | 0% |
| China (Shenzhen) | SZCOMP Index | 0.3% |
| China (STAR Board) | Star50 Index | 0% |
| Mainland Turnover | .chturn Index | -15.9% |
| Japan | NKY Index | 0.6% |
| India | SENSEX Index | -0.1% |
| Indonesia | JCI Index | 1.6% |
| Malaysia | FBMKLCI Index | -0.4% |
| Pakistan | KSE100 Index | -0.1% |
| Philippines | PCOMP Index | 0.1% |
| South Korea | KOSPI Index | 2.4% |
| Taiwan | TWSE Index | -0.5% |
| Thailand | SET Index | -0.3% |
| Singapore | STI Index | 0.4% |
| Australia | AS51 Index | -0.8% |
| Vietnam | VNINDEX Index | -0.0005 |
| Indicator | Hong Kong | Mainland China |
|---|---|---|
| Today's Volume % of 1-Year Average | 92 | 85 |
| Advancing Stocks | 192 | 2018 |
| Declining Stocks | 321 | 2974 |
| Outperforming Factors | Quality, Low Volatility | Momentum, Liquidity, EPS Revision |
| Underperforming Factors | Large Caps, ESG Score, Growth | Value, Dividend Yield, Low Volatility |
| Top Sectors | Materials, Energy, Staples | Energy, Tech, Communication |
| Bottom Sectors | Healthcare, Discretionary, Tech | Staples, Healthcare, Utilities |
| Top Subsectors | Household/Personal Products, Telecom Services, Steel | Communication Equipment, Internet, Energy Equipment |
| Bottom Subsectors | Pharmaceuticals, Electrical Equipment, Financial Services | Cultural Media, Daily Chemical, Insurance |
| Southbound Connect Buys | Minimax, Tencent, Z AI (Large), SMIC, YOFC (Moderate), KB Laminates (Small) | N/A |
| Southbound Connect Sells | Alibaba, Lenovo (Large), Meituan (Moderate), Hua Hong Semi (Small) | N/A |
| MSCI China All Shares Index | # of Stocks | Average 1-Day Change (%) |
|---|---|---|
| Hong Kong Listed | 165 | -1.14 |
| Communication Services | 11 | -0.29 |
| Consumer Discretionary | 28 | -2.14 |
| Consumer Staples | 13 | 0.41 |
| Energy | 6 | 0.7 |
| Financials | 25 | -1.05 |
| Health Care | 16 | -2.54 |
| Industrials | 22 | -1.19 |
| Information Technology | 12 | -1.92 |
| Materials | 14 | 1.07 |
| Real Estate | 7 | -0.5 |
| Utilities | 11 | -0.43 |
| Mainland China Listed | 386 | 0.13 |
| Communication Services | 8 | 1.25 |
| Consumer Discretionary | 26 | -0.94 |
| Consumer Staples | 19 | -1.37 |
| Energy | 12 | 1.37 |
| Financials | 64 | -0.97 |
| Health Care | 31 | -1.34 |
| Industrials | 58 | -0.31 |
| Information Technology | 95 | 1.26 |
| Materials | 52 | 1.07 |
| US & Hong Kong Dually Listed | Ticker | 1-Day Change (%) |
|---|---|---|
| Tencent HK | 700 HK Equity | -0.2 |
| Alibaba HK | 9988 HK Equity | -1.6 |
| JD.com HK | 9618 HK Equity | -10.4 |
| NetEase HK | 9999 HK Equity | 1 |
| Yum China HK | 9987 HK Equity | -1.6 |
| Baozun HK | 9991 HK Equity | 0.1 |
| Baidu HK | 9888 HK Equity | -2.1 |
| Autohome HK | 2518 HK Equity | -2.9 |
| Bilibili HK | 9626 HK Equity | -1 |
| Trip.com HK | 9961 HK Equity | -1.4 |
| EDU HK | 9901 HK Equity | -2.2 |
| Xpeng HK | 9868 HK Equity | 0.3 |
| Weibo HK | 9898 HK Equity | -1.7 |
| Li Auto HK | 2015 HK Equity | -1.6 |
| Nio Auto HK | 9866 HK Equity | -0.4 |
| Zhihu HK | 2390 HK Equity | -2.7 |
| KE HK | 2423 HK Equity | -1.6 |
| Tencent Music Entertainment HK | 1698 HK Equity | 2 |
| Meituan HK | 3690 HK Equity | -4.4 |
| Hong Kong's Most Heavily Traded by Value | 1-Day Change (%) |
|---|---|
| Z AI CO LTD | -3.6 |
| TENCENT HOLDINGS LTD | -0.2 |
| SEMICONDUCTOR MANUFACTURI-H | 4.8 |
| MINIMAX GROUP INC | -12.7 |
| HUA HONG GRACE SEMICONDUCTOR | -11.5 |
| LENOVO GROUP LTD | -3.7 |
| ALIBABA GROUP HOLDING LTD | -1.6 |
| MEITUAN-CLASS B | -4.4 |
| JD.COM INC-CLASS A | -10.4 |
| YANGTZE OPTICAL FIBRE AND-H | 2 |
| Shanghai and Shenzhen's Most Heavily Traded by Value | 1-Day Change (%) |
|---|---|
| CXMT CORP-A | 4.3 |
| GIGADEVICE SEMICONDUCTO-CL A | 3.2 |
| HENGTONG OPTIC-ELECTRIC CO-A | 10 |
| ZHONGJI INNOLIGHT CO LTD-A | 2.4 |
| EOPTOLINK TECHNOLOGY INC L-A | 4.2 |
| SUZHOU TFC OPTICAL COMMUNI-A | 4.1 |
| JIANGSU ZHONGTIAN TECHNOLO-A | 8.1 |
| UNISPLENDOUR CORP LTD-A | 0.9 |
| CHINA JUSHI CO LTD -A | 5.9 |
| SUZHOU DONGSHAN PRECISION-A | 1.5 |
Last Night's Exchange Rates, Prices, & Yields
- CNY per USD 6.74 versus 6.74 yesterday
- CNY per EUR 7.79 versus 7.78 yesterday
- Yield on 10-Year Government Bond 1.70% versus 1.70% yesterday
- Yield on 10-Year China Development Bank Bond 1.76% versus 1.76% yesterday
- Copper Price -0.14%
- Steel Price 0.53%