China Stages Massive Rebound, Dismissing The Margin Misnomer, Week in Review
7 Min. Read Time
Week in Review
- Asian equities were mixed this week as Pakistan and Thailand outperformed, while Mainland China and Australia underperformed.
- Would you believe the Hang Seng Index ended the week up by +1.27%? The Hang Seng Tech Index was barely positive, at +0.23%, though Shanghai and Shenzhen were off -1.23% and -1.61%, respectively, for the week, despite today’s meteoric rebound.
- On Monday, while US markets were closed for Labor Day, Alibaba surged +18% in Hong Kong, following Friday’s post-close results, powered by AI and Cloud strength.
- Healthcare stocks represented a bright spot in a choppy week, on new drug trials and policy support indications for health technology.
Key News
Asian equities ended the week higher, led by a strong and broad rebound in Hong Kong and China. Taiwan outperformed, while Indonesia, Malaysia, and Pakistan were closed for Mawlid-al-Nabi.
As we’ve mentioned this week, the Mainland market is working off a significant overbought condition, though the uptrend remains in place, in my opinion. The Mainland and Hong Kong growth stocks, subsectors, and factors dumped yesterday outperformed significantly today. Take yesterday’s winners and they were today’s losers, and vice versa. Today’s rally was in spite of the Hang Seng Index rebalance, which included capping Alibaba, which gained +1.54% and Tencent, which gained +2.19%.
The market also shrugged off some negative headlines. Anthropic said it will not offer Claude to Chinese companies. Mexico floated tariffs on China.
Growth stocks led the incredible breadth in both markets. The top-performing subsectors in Hong Kong, all of which were yesterday’s underperformers, were pharmaceuticals, non-ferrous metals, electronic equipment makers, and internet stocks. Similarly, on the Mainland, technology hardware stocks, including electronic and communication equipment, and non-ferrous metals, led gains, while yesterday’s winners, including banks, fell.
There were several positive catalysts:
- Mainland media reported that policies on “expanding service consumption are expected to be launched in the near future." The focus will be on tourism, which I assume will be good for Trip.com, which gained +1.78% in Hong Kong today, “internet plus medical”, which is good for JD Health, which fell -0.85%, and Alibaba Health, which is flat.
- The People’s Bank of China (PBOC) announced it will be restarting its “bond trading operation” in order to “stabilize bond prices” due to the “seesaw effect between stocks and bonds, the pressure of recent bond price correction is relatively large”. Year-to-date, the yield on the 10-Year government bond has increased by 10 basis points, while the 30-year yield has fallen by 15 basis points (yields rise when bond prices fall). Doesn’t sound like much to me as a knuckle-dragging equity Neanderthal, though even I can see that the 40-basis-point move in the 1-year, and the 32-basis-point move in the 2-year are significant. I assume this is driven by money coming into the stock market and out of the bond market and bank deposits.
- The PBOC also injected liquidity into the financial system with a RMB 1 trillion reverse repo operation, as yesterday’s kerfuffle clearly hit a few folks' radar.
- Next week’s National People’s Congress (NPC) meeting in Beijing, which begins on September 8th, will include an examination of a “draft nuclear energy law”.
Mainland investors were net buyers of Hong Kong-listed stocks and ETFs via Southbound Stock Connect overnight, as Alibaba and Meituan saw strong net buying.
Yesterday, I caught up with the ACG Analytics team, a Washington, D.C.-based political research firm, to catch up on their views of U.S.-China relations. They agreed that it has been quiet as the Republican Congress has read the tea leaves that “El Jefe” (President Trump) appears to want a China trade deal. They brought up the excellent point that there was no news on the Chinese trade team that visited the US last week. The US-China summit could be in November, following the Chinese government meetings in October.
Mainland China has corrected from an overbought position, as the percentage of Mainland stocks above their 10-day moving average reached 82% versus 22% today. Simply looking at how far Mainland indexes were above their 50-day moving average, it was a good sign that markets were due for a breather.
New brokerage accounts have increased, as Mainland investors will reallocate a piece of their assets from low-yielding bank accounts and the bond market into stocks.
Yesterday’s Bloomberg article that mainland regulators wanted to implement “curbs on stock speculation” according to “people familiar with the matter” was widely cited following Thursday’s meltdown. The article included a chart showing that the value of mainland margin debt is at the same level as in 2015, when the Mainland market’s margin-fueled bubble burst. Scary stuff……. or is it? One problem with the margin debt chart is that it needs to be considered relative to total market capitalization. Mainland markets are a lot bigger today than they were in 2015.
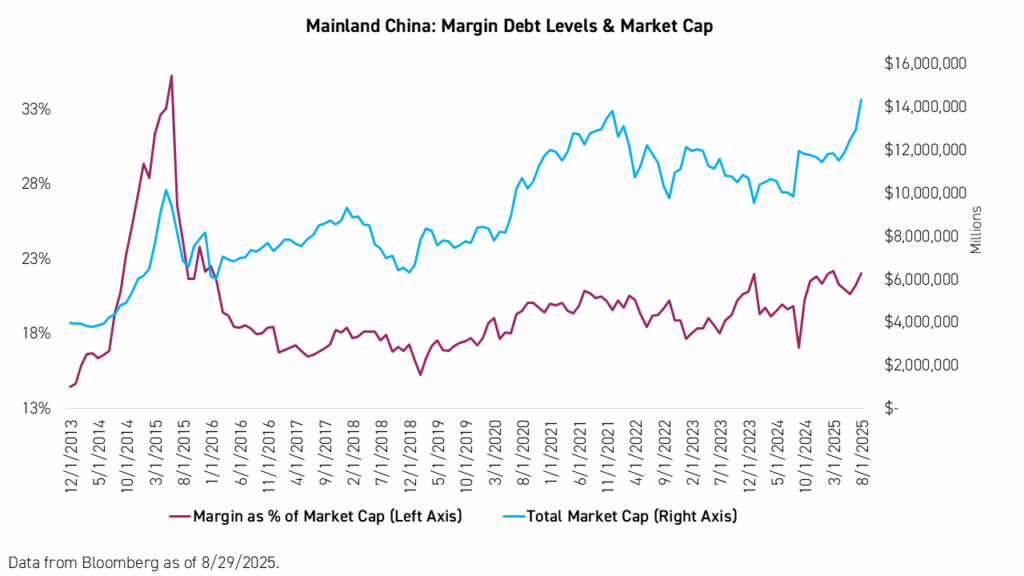
- At the end of May 2015, the market capitalization of Shanghai and Shenzhen was $10.134T.
- At the end of August 2025, the Shanghai and Shenzhen market capitalization was $14.316T.
- You can see where I am going with this: the size of margin debt is the same, but the market cap is 40% bigger!
- At the May 2015 peak, margin debt was 33% of market capitalization, versus 22% at the end of August.From 2013 to 2015, margin debt grew 490%, while market cap grew 157%.
- Margin debt growth as a percentage of market cap growth was 129%.That 490% growth was driven by margin debt, from $567 billion to $3.3 trillion!From 12/31/2013 to 8/29/2025, margin debt grew 50%, while market cap also grew 50%. Margin debt growth as a percentage of market cap growth is just 5.8%.
- Margin debt in this period went from $2.2 trillion to $3.2 trillion.
In my opinion, we are nowhere near the level of concern. I’ll still knock on wood!
Last Night's Performance
| Country / Index | Ticker | 1-Day Change |
|---|---|---|
| China (Hong Kong) | HSI Index | 1.4% |
| Hang Seng Tech | HSTECH Index | 1.9% |
| Hong Kong Turnover | HKTurn Index | -0.8% |
| Hong Kong Short Sale Turnover | HKSST Index | -6.1% |
| Short Turnover as a % of Hong Kong Turnover | N/A | 12.5% |
| Southbound Stock Connect Net Buy/Sell (US $ Millions) | N/A | 718.10 |
| China (Shanghai) | SHCOMP Index | 1.2% |
| China (Shenzhen) | SZCOMP Index | 3.2% |
| China (STAR Board) | Star50 Index | 3.4% |
| Mainland Turnover | .chturn Index | -9.5% |
| Northbound Stock Connect Net Buy/Sell (US $ Millions) | N/A | Not Available |
| Jing Daily China Global Luxury Index | CHINALUX Index | 0.6% |
| Japan | NKY Index | 1% |
| India | SENSEX Index | 0% |
| Indonesia | JCI Index | -0.2% |
| Malaysia | FBMKLCI Index | 0% |
| Pakistan | KSE100 Index | 1.1% |
| Philippines | PCOMP Index | 0.7% |
| South Korea | KOSPI Index | 0.1% |
| Taiwan | TWSE Index | 1.3% |
| Thailand | SET Index | 1% |
| Singapore | STI Index | 0.2% |
| Australia | AS51 Index | 0.5% |
| Vietnam | VNINDEX Index | -1.7% |
| Indicator | Hong Kong | Mainland China |
|---|---|---|
| Today's Volume as % of 1-Year Average | 130 | 166 |
| Advancing Stocks | 425 | 4438 |
| Declining Stocks | 62 | 589 |
| Outperforming Factors | Momentum, EPS Revision, Liquidity | Liquidity, Growth, EPS Revision |
| Underperforming Factors | ||
| Top Sectors | Materials, Healthcare, Communication | Tech, Industrials, Materials |
| Bottom Sectors | Financials, Utilities | |
| Top Subsectors | Non-Ferrous Metals, Semis, Pharmaceuticals | Electric Power Grid, Power Generation, Fine Chemical |
| Bottom Subsectors | Consumer Staples Distribution | Banking, Telecom, Highway |
| Southbound Connect Buys | Alibaba, Meituan (Very Large), Horizon Robot (Large), SMIC, Tencent, Xiaomi (Moderate) | N/A |
| Southbound Connect Sells | 3SBio (Moderate) | N/A |
| MSCI China All Shares Index | # of Stocks | Average 1-Day Change (%) |
|---|---|---|
| Hong Kong Listed | 151 | 1.72 |
| Communication Services | 9 | 2.06 |
| Consumer Discretionary | 28 | 1.4 |
| Consumer Staples | 13 | 0.71 |
| Energy | 7 | 1.19 |
| Financials | 23 | 0.61 |
| Health Care | 13 | 4.67 |
| Industrials | 20 | 1.56 |
| Information Technology | 10 | 1.56 |
| Materials | 10 | 5.03 |
| Real Estate | 6 | 1.4 |
| Utilities | 12 | 2.01 |
| Mainland China Listed | 404 | 2.24 |
| Communication Services | 6 | 1.56 |
| Consumer Discretionary | 31 | 1.82 |
| Consumer Staples | 24 | 0.77 |
| Energy | 13 | 0.75 |
| Financials | 64 | -0.28 |
| Health Care | 31 | 2.98 |
| Industrials | 64 | 3.72 |
| Information Technology | 91 | 5.06 |
| Materials | 58 | 3.33 |
| Real Estate | 6 | 1.06 |
| Utilities | 16 | -0.04 |
| US & Hong Kong Dually Listed | Ticker | 1-Day Change (%) |
|---|---|---|
| Tencent HK | 700 HK Equity | 2.2 |
| Alibaba HK | 9988 HK Equity | 1.5 |
| JD.com HK | 9618 HK Equity | 1.9 |
| NetEase HK | 9999 HK Equity | 1.1 |
| Yum China HK | 9987 HK Equity | 0.2 |
| Baozun HK | 9991 HK Equity | -6.5 |
| Baidu HK | 9888 HK Equity | 1 |
| Autohome HK | 2518 HK Equity | -2 |
| Bilibili HK | 9626 HK Equity | 0.7 |
| Trip.com HK | 9961 HK Equity | 1.8 |
| EDU HK | 9901 HK Equity | -1.5 |
| Xpeng HK | 9868 HK Equity | 1.1 |
| Weibo HK | 9898 HK Equity | 0.4 |
| Li Auto HK | 2015 HK Equity | 0.4 |
| Nio Auto HK | 9866 HK Equity | -0.8 |
| Zhihu HK | 2390 HK Equity | -0.7 |
| KE HK | 2423 HK Equity | 1 |
| Tencent Music Entertainment HK | 1698 HK Equity | 1.3 |
| Meituan HK | 3690 HK Equity | 1.6 |
| Hong Kong's Most Heavily Traded by Value | 1-Day Change (%) |
|---|---|
| ALIBABA GROUP HOLDING LTD | 1.5 |
| TENCENT HOLDINGS LTD | 2.2 |
| MEITUAN-CLASS B | 1.6 |
| SEMICONDUCTOR MANUFACTURI-H | 4.8 |
| HORIZON ROBOTICS INC | 9.1 |
| BYD CO LTD-H | 1.1 |
| POP MART INTERNATIONAL GROUP | 1 |
| XIAOMI CORP-CLASS B | 0.4 |
| KUAISHOU TECHNOLOGY | 4.4 |
| 3SBIO INC | 18.2 |
| Shanghai and Shenzhen's Most Heavily Traded by Value | 1-Day Change (%) |
|---|---|
| ZHONGJI INNOLIGHT CO LTD-A | 10.3 |
| EOPTOLINK TECHNOLOGY INC L-A | 11.9 |
| CAMBRICON TECHNOLOGIES-A | 6.6 |
| VICTORY GIANT TECHNOLOGY -A | 20 |
| CONTEMPORARY AMPEREX TECHN-A | 6.9 |
| SUNGROW POWER SUPPLY CO LT-A | 16.7 |
| FOXCONN INDUSTRIAL INTERNE-A | 5.1 |
| WUXI LEAD INTELLIGENT EQUI-A | 20 |
| EAST MONEY INFORMATION CO-A | 1.5 |
| GOTION HIGH-TECH CO LTD-A | 8.4 |
Last Night’s Exchange Rates, Prices, & Yields
- CNY per USD 7.14 versus 7.14 yesterday
- CNY per EUR 8.36 versus 8.32 yesterday
- Yield on 10-Year Government Bond 1.83% versus 1.81% yesterday
- Yield on 10-Year China Development Bank Bond 1.88% versus 1.87% yesterday
- Copper Price -0.05%
- Steel Price 0.51%