
Export Data Demonstrates China’s Role In AI Supply Chain
6 Min. Read Time
Key News
Asian equities were resilient despite flaring Middle East tensions following yesterday’s resumption of the blockade on Iran and the recent drawdown in AI "picks and shovels", i.e. supply chain stocks, except for Taiwan, which underperformed. Hong Kong and Mainland China rebounded from morning losses, driven by significantly better-than-expected trade data released mid-day.
Other positive catalysts included Premier Li’s convening of “economists and entrepreneurs” to discuss the economy. Li said that there need to be “systematic policy efforts to unlock the potential of domestic demand”. Yesterday, we reported that the State Council’s the 15th Five-Year Plan for Expanding Consumption, which includes a goal of RMB 60 trillion ($8.8 billion) by 2030, seemed to give Hong Kong-listed e-commerce, consumer staples, and consumer discretionary stocks a lift.
The trade data, as well as yesterday’s news on Hengton Optic-Electric, which gained +6.24%, following yesterday’s post-close positive first-half profit announcement, were the key catalysts. Mainland media reported an AI chip that has computing power of 520 trillion floating-point operations per second (TFLOPS) that was fabricated on a 14 nanometer process domestically. Obviously, creating one advanced chip is far from mass production, though the computing capability is the approximate equivalent to a Nvidia H100 chip.
June trade data was key, as China’s role in the AI supply chain is hard to deny, which sent Mainland-listed semiconductors higher, along with Hong Kong’s technology hardware and electronic equipment subsectors.
June Trade Data Overview
- Exports +27% YoY versus May’s +19.4% and expectations of +19%
- Imports +36% YoY versus May’s +27.4% and expectations of +26.1%
- Trade Balance $125 billion versus May’s $105 billion and expectations of $120 billion
The Customs General Administration gave a press conference and Q&A with reporters to discuss the numbers. Key statements included:
o “The export of high-tech products reached CNY 3.26 trillion, an increase of 39%” as in the 1st half of the year
o “Electronic Components and computer components all increased by double digits, driving a total increase of 6.9 percentage points in exports”
o “smart bionic robot deeply integrated with AI technology has exported more than 10,000 units, covering more than 90 countries and regions around the world.”
o Also helping in the 1st half of the year was “China's exports of green energy-related products such as Lithium Battery and wind turbines increased by 37.6% and 35.6%”
Alibaba gained +0.09%, as Mainland investors kept the Southbound Stock Connect win streak going with $13 million worth (HKD 104 million) worth of net buying. Baidu fell -7.26% after it was downgraded, which seemed to weigh on Hong Kong-listed internet stocks, as Tencent fell -0.31 and NetEase fell -2.51%, though Kuaishou gained +0.41%.
Healthcare had a good day in both Hong Kong and Mainland China. 601 drugs passed the final review round for inclusion in the medical insurance drug list.
Energy had a good day in both markets, along with non-ferrous metals.
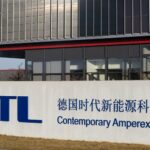
Technology hardware lifted the Shenzhen Component Index higher by +2.26%. Shenzhen was led by CATL, which gained +1.38%, while semiconductors were a touch mixed with Science and Technology (STAR) Board +0.77%.
After the close, LONGi Green Energy, which gained +0.81%, reported it will report a profit loss between RMB 3.4 billion and RMB 3.8 billion. We would love to see anti-involution efforts refocused on solar companies.
The Financial Times is reporting that DeepSeek is looking to raise money at a $70 billion valuation, following a May fundraise of $7 billion, at a $52 billion valuation, representing a 37% increase. How has the market re-rated Alibaba, Kuaishou or Baidu or Tencent for their AI efforts? Not so much!
Fast fashion retailer Shein is looking to raise $3 billion through a Hong Kong IPO.
Last Night's Performance
| Country / Index | Ticker | 1-Day Change |
|---|---|---|
| China (Hong Kong) | HSI Index | 0.5% |
| Hang Seng Tech | HSTECH Index | 0.1% |
| Hong Kong Turnover | HKTurn Index | 1.1% |
| Hong Kong Short Sale Turnover | HKSST Index | -10.9% |
| Short Turnover as a % of Hong Kong Turnover | N/A | 0.2 |
| Southbound Stock Connect Net Buy/Sell (US $ Millions) | N/A | 1404.45606641124 |
| China (Shanghai) | SHCOMP Index | 1.4% |
| China (Shenzhen) | SZCOMP Index | 2.3% |
| China (STAR Board) | Star50 Index | 0.8% |
| Mainland Turnover | .chturn Index | -3.9% |
| Japan | NKY Index | 0.7% |
| India | SENSEX Index | -0.7% |
| Indonesia | JCI Index | 0% |
| Malaysia | FBMKLCI Index | 1.3% |
| Pakistan | KSE100 Index | -3.5% |
| Philippines | PCOMP Index | -0.2% |
| South Korea | KOSPI Index | 0.7% |
| Taiwan | TWSE Index | -1.4% |
| Thailand | SET Index | -0.1% |
| Singapore | STI Index | 0.5% |
| Australia | AS51 Index | 0% |
| Vietnam | VNINDEX Index | -0.0005 |
| Indicator | Hong Kong | Mainland China |
|---|---|---|
| Today's Volume % of 1-Year Average | 114 | 114 |
| Advancing Stocks | 353 | 3538 |
| Declining Stocks | 153 | 1516 |
| Outperforming Factors | Momentum, EPS Revision, Liquidity | EPS Revision, Momentum, Large Caps |
| Underperforming Factors | None | None |
| Top Sectors | Materials, Energy, Industrials | Materials, Tech, Energy |
| Bottom Sectors | Communication | Communication |
| Top Subsectors | Non Ferrous Metals, Paper/Packaging, Tech hardware | Communication Equipment, Precious Metals, Building Materials |
| Bottom Subsectors | Software, National Defense, Banks | Aerospace/Military, Internet, Software |
| Southbound Connect Buys | Knowledge Atlas (Very Large), KB Laminates, SMIC, YOFC (Moderate), Alibaba, Tencent (Small) | N/A |
| Southbound Connect Sells | None | N/A |
| MSCI China All Shares Index | # of Stocks | Average 1-Day Change (%) |
|---|---|---|
| Hong Kong Listed | 165 | 0.64 |
| Communication Services | 11 | -0.92 |
| Consumer Discretionary | 28 | 0.84 |
| Consumer Staples | 13 | 0.65 |
| Energy | 6 | 2.64 |
| Financials | 25 | 0.53 |
| Health Care | 16 | 0.65 |
| Industrials | 22 | 1.57 |
| Information Technology | 12 | 1.52 |
| Materials | 14 | 5.11 |
| Real Estate | 7 | 0.97 |
| Utilities | 11 | 0.64 |
| Mainland China Listed | 386 | 2.13 |
| Communication Services | 8 | -2.1 |
| Consumer Discretionary | 26 | 1.19 |
| Consumer Staples | 19 | 0.32 |
| Energy | 12 | 3.27 |
| Financials | 64 | 0.33 |
| Health Care | 31 | 1.77 |
| Industrials | 58 | 1.11 |
| Information Technology | 95 | 3.28 |
| Materials | 52 | 5.04 |
| US & Hong Kong Dually Listed | Ticker | 1-Day Change (%) |
|---|---|---|
| Tencent HK | 700 HK Equity | -0.3 |
| Alibaba HK | 9988 HK Equity | 0.1 |
| JD.com HK | 9618 HK Equity | 0.5 |
| NetEase HK | 9999 HK Equity | -2.5 |
| Yum China HK | 9987 HK Equity | 0.6 |
| Baozun HK | 9991 HK Equity | 0 |
| Baidu HK | 9888 HK Equity | -7.3 |
| Autohome HK | 2518 HK Equity | 0.5 |
| Bilibili HK | 9626 HK Equity | 1.2 |
| Trip.com HK | 9961 HK Equity | 0.4 |
| EDU HK | 9901 HK Equity | 1.2 |
| Xpeng HK | 9868 HK Equity | 3.1 |
| Weibo HK | 9898 HK Equity | 0.3 |
| Li Auto HK | 2015 HK Equity | 2.9 |
| Nio Auto HK | 9866 HK Equity | 8.7 |
| Zhihu HK | 2390 HK Equity | 0.2 |
| KE HK | 2423 HK Equity | 0.8 |
| Tencent Music Entertainment HK | 1698 HK Equity | 1.2 |
| Meituan HK | 3690 HK Equity | 1.6 |
| Hong Kong's Most Heavily Traded by Value | 1-Day Change (%) |
|---|---|
| TENCENT HOLDINGS LTD | -0.3 |
| KNOWLEDGE ATLAS TECHNOLOGY-H | -2.7 |
| ALIBABA GROUP HOLDING LTD | 0.1 |
| SEMICONDUCTOR MANUFACTURI-H | 0 |
| KINGBOARD LAMINATES HLDG LTD | 14.2 |
| HUA HONG GRACE SEMICONDUCTOR | -0.5 |
| XIAOMI CORP-CLASS B | 0.8 |
| NETEASE INC | -2.5 |
| GIGADEVICE SEMICONDUCTOR I-H | 9.5 |
| YANGTZE OPTICAL FIBRE AND-H | 10.2 |
| Shanghai and Shenzhen's Most Heavily Traded by Value | 1-Day Change (%) |
|---|---|
| ZHONGJI INNOLIGHT CO LTD-A | 6.9 |
| GIGADEVICE SEMICONDUCTO-CL A | 6 |
| EOPTOLINK TECHNOLOGY INC L-A | 11 |
| JCET GROUP CO LTD-A | 3.7 |
| SUZHOU DONGSHAN PRECISION-A | 10 |
| TIANSHUI HUATIAN TECHNOLOG-A | 6.4 |
| BOE TECHNOLOGY GROUP CO LT-A | 2.8 |
| CAMBRICON TECHNOLOGIES-A | 1.5 |
| SEMICONDUCTOR MANUFACTURIN-A | -1.6 |
| TONGFU MICROELECTRONIC CO-A | 5.8 |
Last Night's Exchange Rates, Prices, & Yields
- CNY per USD 6.78 versus 6.78 yesterday
- CNY per EUR 7.73 versus 7.75 yesterday
- Yield on 10-Year Government Bond 1.74% versus 1.74% yesterday
- Yield on 10-Year China Development Bank Bond 1.82% versus 1.82% yesterday
- Copper Price 0.78%
- Steel Price 0.23%