
No Winners In A Trade War
6 Min. Read Time
Key News
Asian equities were mixed overnight as the Philippines, Taiwan, and South Korea outperformed, Thailand underperformed, and Pakistan was closed for Kashmir Solidarity Day.
The tariff tit-for-tat overnight weighed on market sentiment except for metals and mining companies as gold surged, as well as AI plays such as semiconductors, software, and technology hardware, which could also be related to the early success of the new electronic trade in subsidy.
News that the US Postal Service would suspend non-letter parcels from Hong Kong and Mainland China and the announcement of an investigation into Shein and PDD's Temu weighed on sentiment as well. This morning, the US Postal Service stated it is no longer canceling parcel delivery as the Art of the Deal requires some volatility!
Locals resembled traders rather than investors, taking quick profits, including Mainland investors, with a rare net sell of -$680 million, mainly the Hong Kong Tracker ETF via Southbound Stock Connect. News that the Chinese government might investigate Apple is a subtle reminder that they have levers that can hurt the US government and, unfortunately, US investors. We have long stated that there are about ~$376 billion worth of US goods made and sold in China, according to the NY Federal Reserve Bank, that are not by definition “exports”, though those revenues and profits flow to the US.
The Ministry of Commerce (MoC) announced it would begin applying export controls of tungsten, bismuth, and molybdenum. Regardless, today’s market action clearly indicates that nobody wins in a trade war, so, hopefully, the two sides can put the kabuki theater aside and meet.
The most ridiculous thing you’ll read is how the Caixin Services PMI “missed” economist expectations as only five firms, of which only two economists submitted estimates. I would start submitting an “expert” estimate for fun if I had the bandwidth. The January release was 51 versus “expert” expectations of 52.4 and December’s 52.2. It was interesting that consumer stocks were off despite early indications that Chinese New Year vacation numbers were robust.
There were some positives, including battery maker CATL's post-close announcement that it would relist in Hong Kong. The relisting of Mainland companies in Hong Kong could raise China’s weight in MSCI indices. As an FYI, remember that Mainland listed stocks only get 20% of their market cap added to MSCI indices.
Premier Li presided over a State Council meeting that generated nothing tangible except for more sound bites, including the statement “a more proactive approach to promote high-quality development and achieve new results.”
By far, the most interesting news today was a report stating the new home price index in 100 cities increased by 0.23% in January, as 47 cities showed price increases month-over-month (MoM), 41 saw MoM price decreases, and 12 were unchanged. Year-over-year (YoY), 61 cities had an increase, 39 had a decline, and zero were unchanged. For comparison purposes, in September and pre-real estate stimulus measures, 17 cities experienced an increase, and 63 showed a decline in MoM data. The richer the city, the better real estate is doing, as Tier 1 leads the way back. A Mainland media article noted that the "national "white list" project loan approval amount exceeded CNY 5 trillion” with 3.73 million apartments completed. The article specifically mentioned distressed state-owned enterprise (SOE) developer Vanke, which last Monday was effectively “localized", i.e. taken over by the Shenzhen local government, which completed 180,000 apartments. If Xi and Trump can do a trade deal, I suspect a major real estate stimulus could occur. Hopefully, they get to it!
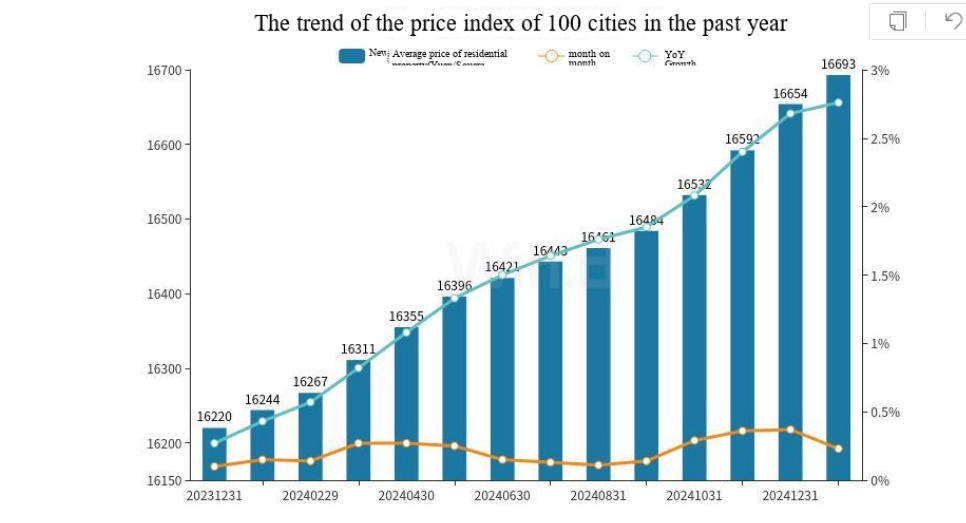
Source: Wind
The Hang Seng and Hang Seng Tech indexes fell -0.93% and -0.95%, respectively, on volume that increased +18.74% from yesterday, which is 140% of the 1-year average. 178 stocks advanced, while 309 declined. Main Board short turnover increased by +5.72% from yesterday, which is 148% of the 1-year average, as 16% of turnover was short turnover (Hong Kong short turnover includes ETF short volume, which is driven by market makers’ ETF hedging). The value factor and large capitalization stocks fell less than the growth factor and small capitalization stocks. The top-performing sectors were materials, which gained +1.15% and technology, up +0.62%. Meanwhile, the worst-performing sectors were Consumer Staples, which fell -2.67%, Real Estate, which fell -1.64%, and Consumer Discretionary, which fell -1.61%. The top-performing subsectors were nonferrous metals, technology hardware, and national defense. Meanwhile, textiles, food, and household appliances were among the worst-performing. Southbound Stock Connect volumes were 2x pre-stimulus levels as Mainland investors sold a net -$680 million worth of Hong Kong-listed stocks and ETFs, including the Hong Kong Tracker ETF, Tencent, Kingsoft Cloud, Meituan, Semiconductor Manufacturing International (SMIC), and Xiaomi. Alibaba and Kuaishou were small net buys.
Shanghai, Shenzhen, and the STAR Board diverged to close -0.65%, +0.44%, and +2.90%, respectively, on volume that was up +15.46% from last Monday, which is 117% of the 1-year average. 3,274 stocks advanced, while 1,744 stocks declined. The growth factor and small capitalization stocks outperformed the value factor and large capitalization stocks. The top-performing sectors were Communication Services, up +3.22%, and Information Technology, up +0.99%. Meanwhile, the worst-performing sectors were Energy, which fell -2.21%, Consumer Staples, which fell -2.07%, and Real Estate, which fell -1.56%. The top-performing subsectors were internet, software, and education. Meanwhile, soft drinks, motorcycles, and energy equipment were among the worst-performing subsectors. Northbound Stock Connect volumes were above average. CNY and the Asia Dollar Index fell versus the US dollar. Treasury bonds rallied. Copper and steel fell.
Last Night's Performance
| Country/Index | Ticker | 1-Day Change |
|---|---|---|
| China (Hong Kong) | HSI Index | 0.1% |
| Hang Seng Tech | HSTECH Index | 0.8% |
| Hong Kong Turnover | HKTurn Index | -64.9% |
| HK Short Sale Turnover | HKSST Index | -65.4% |
| Short Turnover as a % of HK Turnovr | N/A | 15.2% |
| Southbound Stock Connect Net Buy/Sell (US $ Millions) | N/A | 1053.6 |
| China (Shanghai) | SHCOMP Index | -0.1% |
| China (Shenzhen) | SZCOMP Index | -1.3% |
| China (STAR Board) | Star50 Index | -2% |
| Mainland Turnover | .chturn Index | 0% |
| Nouthbound Stock Connect Net Buy/Sell (US $ Millions) | N/A | Not Available |
| Jing Daily China Global Luxury Index | CHINALUX Index | 0% |
| Japan | NKY Index | -1.4% |
| India | SENSEX Index | 0.7% |
| Indonesia | JCI Index | -0.9% |
| Malaysia | FBMKLCI Index | -0.4% |
| Pakistan | KSE100 Index | -1.2% |
| Philippines | PCOMP Index | -0.7% |
| South Korea | KOSPI Index | 0.8% |
| Taiwan | TWSE Index | 1% |
| Thailand | SET Index | 0.4% |
| Singapore | STI Index | 0.1% |
| Australia | AS51 Index | -0.1% |
| MSCI China All Shares Index | # of Stocks | Average 1-Day Change (%) |
|---|---|---|
| Hong Kong Listed | 152 | -0.89 |
| Communication Services | 9 | -0.41 |
| Consumer Discretionary | 30 | -1.61 |
| Consumer Staples | 13 | -2.66 |
| Energy | 7 | -0.47 |
| Financials | 23 | -1.05 |
| Health Care | 13 | -0.64 |
| Industrials | 19 | -0.18 |
| Information Technology | 10 | 0.62 |
| Materials | 10 | 1.16 |
| Real Estate | 6 | -1.64 |
| Utilities | 12 | -0.31 |
| Mainland China Listed | 432 | -0.84 |
| Communication Services | 9 | 3.22 |
| Consumer Discretionary | 31 | -0.47 |
| Consumer Staples | 27 | -2.07 |
| Energy | 16 | -2.21 |
| Financials | 63 | -1.3 |
| Health Care | 40 | -0.13 |
| Industrials | 69 | -1.55 |
| Information Technology | 85 | 0.99 |
| Materials | 68 | -0.52 |
| Real Estate | 7 | -1.56 |
| Utilities | 17 | -1.56 |
| US & Hong Kong Dually Listed | Ticker | 1-Day Change (%) |
|---|---|---|
| Tencent HK | 700 HK Equity | 1.4 |
| Alibaba HK | 9988 HK Equity | 1.2 |
| JD.com HK | 9618 HK Equity | -0.3 |
| NetEase HK | 9999 HK Equity | 1.7 |
| Yum China HK | 9987 HK Equity | -1.2 |
| Baozun HK | 9991 HK Equity | 1.4 |
| Baidu HK | 9888 HK Equity | 3.6 |
| Autohome HK | 2518 HK Equity | 2 |
| Bilibili HK | 9626 HK Equity | 1.1 |
| Trip.com HK | 9961 HK Equity | -0.5 |
| EDU HK | 9901 HK Equity | 3.7 |
| Xpeng HK | 9868 HK Equity | 1.5 |
| Weibo HK | 9898 HK Equity | 1.5 |
| Li Auto HK | 2015 HK Equity | -0.1 |
| Nio Auto HK | 9866 HK Equity | 0 |
| Zhihu HK | 2390 HK Equity | -0.1 |
| KE HK | 2423 HK Equity | 1.8 |
| Tencent Music Entertainment HK | 1698 HK Equity | 0 |
| Meituan HK | 3690 HK Equity | -1 |
| Hong Kong's Most Heavily Traded by Value | 1-Day Change (%) |
|---|---|
| TENCENT HOLDINGS LTD | 1.4 |
| ALIBABA GROUP HOLDING LTD | 1.2 |
| MEITUAN-CLASS B | -1 |
| XIAOMI CORP-CLASS B | 3.2 |
| SEMICONDUCTOR MANUFACTURING | -0.4 |
| KUAISHOU TECHNOLOGY | 5.9 |
| JD.COM INC-CLASS A | -0.3 |
| LENOVO GROUP LTD | 4 |
| BYD CO LTD-H | -1 |
| AIA GROUP LTD | 1.1 |
| Shanghai and Shenzhen's Most Heavily Traded by Value | 1-Day Change (%) |
|---|---|
| ZTE CORP-A | 6.5 |
| SEMICONDUCTOR MANUFACTURIN-A | 7.9 |
| ZHONGJI INNOLIGHT CO LTD-A | -14.4 |
| IEIT SYSTEMS CO LTD-A | 7.3 |
| IFLYTEK CO LTD - A | 7.4 |
| DAWNING INFORMATION INDUST-A | 7.6 |
| CAMBRICON TECHNOLOGIES-A | 0.7 |
| EAST MONEY INFORMATION CO-A | 0.2 |
| JIANGSU HOPERUN SOFTWARE C-A | 15.5 |
| HYGON INFORMATION TECHNOLO-A | 8.7 |
Last Night’s Exchange Rates, Prices, & Yields
- CNY per USD 7.27
- CNY per EUR 7.57
- Yield on 10-Year Government Bond 1.62%
- Yield on 10-Year China Development Bank Bond 1.64%
- Copper Price -0.46%
- Steel Price -0.30%