
Q3 Financial Results: So, Are You Saying There Is A Chance?

6 Min. Read Time

Key New

Asian equities were lower on light volumes as rising Middle East tensions curbed risk sentiment after Korea reopened with a thud. There are a few points to highlight on an otherwise quiet night.

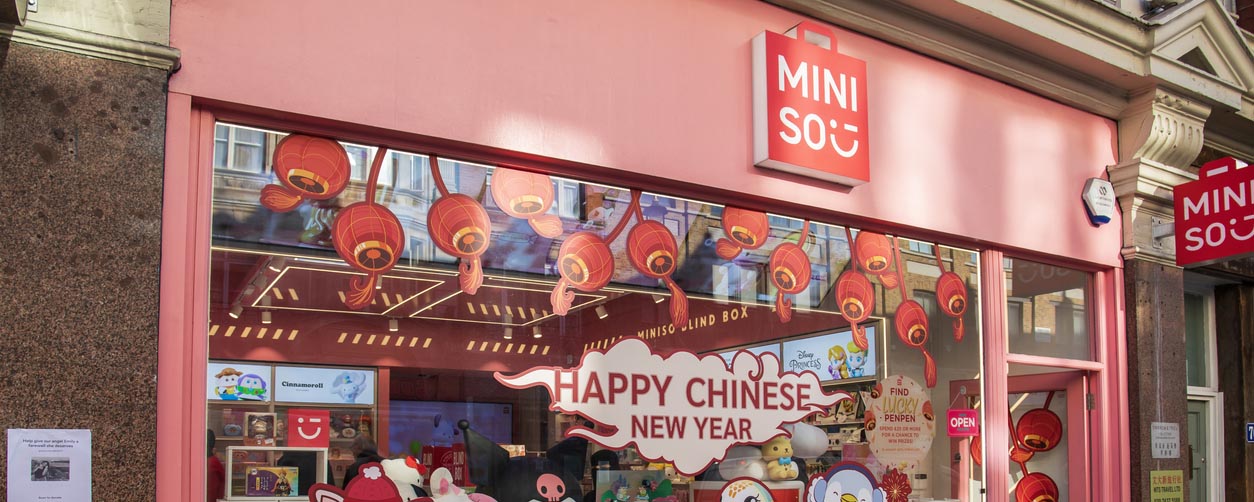
The Hong Kong-listed discount retailer Miniso gained +7.68% overnight after announcing third quarter China gross merchandise value (GMV) increased between +25% and +30% year-over-year (YoY) ahead of Q3 financial results. The stock is slightly above its 52-week and all-time lows, having fallen -66.89% from its all-time high, which occurred in September of 2023. The low bar in YoY comparisons could be a catalyst as we head into earnings season for the third quarter. Hong Kong-listed E-Commerce stocks were mostly higher, as Alibaba gained +1.12%, JD.com gained +2.75%, and Meituan gained +0.42%.

China’s Ministry of Commerce (MoC) and the European Commissioner for Trade & Economic Security agreed to an annual import quota of 350,000 hybrid and fully-electric vehicles versus 2025’s 302,000. Hong Kong and Mainland-listed automakers were lower on the news, though battery giant CATL was higher. 

China’s AI supply chain was mostly lower again. Apple's iPhone production curbs and Korea’s downdraft weighed on the supply chain stocks in both Mainland China and Hong Kong. In a one-two punch for the AI supply chain, a US-led patent lawsuit was initiated against Apple suppliers Luxshare, which fell -2.08% in Hong Kong, and Foxconn, which fell -7.17% in China. The semiconductor, semiconductor equipment, electronic equipment, and communications equipment subsectors were all lower in both markets. As a consequence, the Science & Technology (STAR) Board fell -2.1%.

Mainland media broadcasted an NBA China game in Macau, showing Joe Tsai, Jack Ma, and David Beckham sitting together.

Tencent gained +0.12% and was Hong Kong’s most heavily traded stock by value. Bloomberg News reported the company is telling investors that its $5 billion bond offering will be used for AI capex. There was also chatter that both Alibaba and Tencent will launch tools similar to Meta’s Muse. Defensive plays like banks and energy were higher in both markets. The domestic equity ETFs favored by China's "National Team", i.e. investment firms associated with sovereign wealth, were below average, though they did see inflows on Friday.

There was an interesting article in Mainland China based on research from Epoch AI comparing Anthropic’s $65 billion worth of AI revenue and OpenAI’s $40 billion to a combined $4 billion in total AI revenue across ByteDance, Alibaba, Z AI, Moonshot, DeepSeek, and MiniMax. It is important to note that the China revenue total excludes cloud computing and advertising revenue. The former is the primary revenue driver for Alibaba, Baidu, and Tencent. Alibaba’s second quarter cloud revenue growth was +45% to $7.1 billion. The two US giants have an entirely different business model from their China peers, as they focus on enterprise solutions. It is a long article, so I will dig in further and report back.

Finance-related agency heads of the People's Bank of China (PBOC) and the China Securities Regulatory Commission (CSRC) will attend next week’s Financial Street Forum Annual Meeting running from October 19th to 22nd. There is no major news expected from the Forum, outside of the usual positive economic policy support releases, though last week’s allocation of consumer subsidies was a positive.

Tencent announced share buybacks after the close.

Last Night's Performance

Australia shines as Asia slips broadly

5 of 17 markets were up; Australia was the standout gainer.

+0.8%
Australia (best)
-3.6%
South Korea (worst)
+ 332
Southbound Connect (US$ mn)
MarketChange1-Day
Australia
AS51 Index
+0.8%
Philippines
PCOMP Index
+0.7%
Malaysia
FBMKLCI Index
+0.6%
Singapore
STI Index
+0.3%
China (Hong Kong)
HSI Index
+0.2%
Japan
NKY Index
0.0%
Taiwan
TWSE Index
0.0%
Thailand
SET Index
-0.4%
China (Shanghai)
SHCOMP Index
-0.4%
Hang Seng Tech
HSTECH Index
-0.7%
India
SENSEX Index
-0.8%
Vietnam
VNINDEX Index
-0.8%
Pakistan
KSE100 Index
-1.2%
China (Shenzhen)
SZCOMP Index
-1.8%
China (STAR Board)
STAR50 Index
-2.1%
Indonesia
JCI Index
-2.6%
South Korea
KOSPI Index
-3.6%
Hong Kong and Mainland China Liquidity (1-Day Change)
Hong Kong Turnover
HKTurn Index
-22.3%
Hong Kong Short Sale Turnover
HKSST Index
-18.8%
Short Turnover as % of HK Turnover
27.06%
Southbound Connect Net Buy/Sell (US$ mn)
+332
Mainland Turnover
.CHTURN Index
-19.0%

Low Volatility leads as the top factor in both Hong Kong and Mainland China

207 / 356
HK Advancing / Declining
1,134 / 3,944
Mainland Advancing / Declining
IndicatorHong KongMainland China
Volume % of 1-Year Average62%63%
Advancing / Declining207 / 3561,134 / 3,944
Outperforming FactorsLow VolatilityLow VolatilityValueDividend Yield
Underperforming FactorsLiquidityGrowthESG ScoreMomentumEPS RevisionLiquidity
Top SectorsFinancialsConsumer DiscretionaryIndustrialsFinancialsConsumer StaplesCommunication Services
Bottom SectorsTechnologyMaterialsConsumer StaplesTechnologyMaterialsReal Estate
Top SubsectorsBanksIndustry ConglomeratesEnvironmental ProtectionMotorcyclesBanksConstruction Machinery
Bottom SubsectorsTechnology HardwareSemiconductorsNon-Ferrous MetalsCommunication EquipmentPetrochemicalsEnergy Equipment
Southbound Connect BuysXiaomi (Large)—
Southbound Connect SellsSMIC, YOFC, Alibaba, KB Laminates—

Hong Kong and Mainland China trade broadly lower

-0.42%
Hong Kong listed (152)
-0.44%
Mainland listed (400)
Sector# StocksChangeAvg. 1-Day
Hong Kong Listed · 152 stocks-0.42%
Financials24
+1.51%
Consumer Discretionary27
+0.49%
Industrials16
+0.37%
Communication Services7
+0.36%
Utilities10
+0.31%
Energy7
-0.45%
Real Estate6
-0.46%
Health Care15
-0.52%
Consumer Staples12
-0.73%
Materials14
-1.48%
Information Technology14
-3.98%
Mainland China Listed · 400 stocks-0.44%
Financials60
+1.59%
Consumer Staples16
+1.42%
Communication Services9
+0.77%
Consumer Discretionary21
+0.28%
Industrials62
-0.10%
Health Care26
-0.30%
Energy11
-1.21%
Materials69
-2.79%
Information Technology126
-3.60%

US & Hong Kong Dually Listed

14 / 4
Up / Down (1 flat)
+3.1%
Tencent Music Ent. (best)
-1.8%
Yum China (worst)
CompanyChange1-Day
Tencent Music Ent.
1698 HK Equity
+3.1%
NetEase
9999 HK Equity
+2.9%
JD.com
9618 HK Equity
+2.7%
Zhihu
2390 HK Equity
+2.7%
New Oriental (EDU)
9901 HK Equity
+1.6%
KE Holdings
2423 HK Equity
+1.2%
Alibaba
9988 HK Equity
+1.1%
Li Auto
2015 HK Equity
+0.5%
Xpeng
9868 HK Equity
+0.4%
Weibo
9898 HK Equity
+0.4%
Meituan
3690 HK Equity
+0.4%
Baozun
9991 HK Equity
+0.3%
Tencent
700 HK Equity
+0.2%
Nio
9866 HK Equity
+0.1%
Autohome
2518 HK Equity
0.0%
Trip.com
9961 HK Equity
-0.4%
Bilibili
9626 HK Equity
-1.1%
Baidu
9888 HK Equity
-1.4%
Yum China
9987 HK Equity
-1.8%

Tencent Holdings rises +0.2% as Hong Kong's top stock by value

Value Traded Rank · CompanyChange1-Day
1Tencent Holdings
+0.2%
2Alibaba Group Holding
+1.1%
3Xiaomi
-5.5%
4SMIC
-2.5%
5Kingboard Laminates
-4.5%
6Yangtze Optical Fibre
-7.2%
7AIA Group
+0.9%
8Lenovo Group
-1.5%
9BYD
-1.7%
10CNOOC
+1.0%

CATL leads gains as Zhongji Innolight pulls back among Shanghai & Shenzhen's most-traded

Value Traded Rank · CompanyChange1-Day
1Zhongji Innolight
-6.4%
2CATL
+0.2%
3Eoptolink Technology
-6.1%
4CXMT Corp
-5.2%
5Suzhou Dongshan Precision
-6.6%
6Cambricon Technologies
-1.4%
7Gigadevice Semiconductor
-4.8%
8Suzhou TFC Optical
-2.3%
9Guangzhou Tinci Materials
-2.6%
10Jinjian Cereals
-8.4%

Last Night's Exchange Rates, Prices, & Yields

  • CNY per USD 6.69 versus 6.69 Friday
  • CNY per EUR 7.48 versus 7.50 Friday
  • Yield on 10-Year Government Bond 1.67% versus 1.69% Friday
  • Yield on 10-Year China Development Bank Bond 1.74% versus 1.75% Friday
  • Copper Price 1.06%
  • Steel Price 0.49%