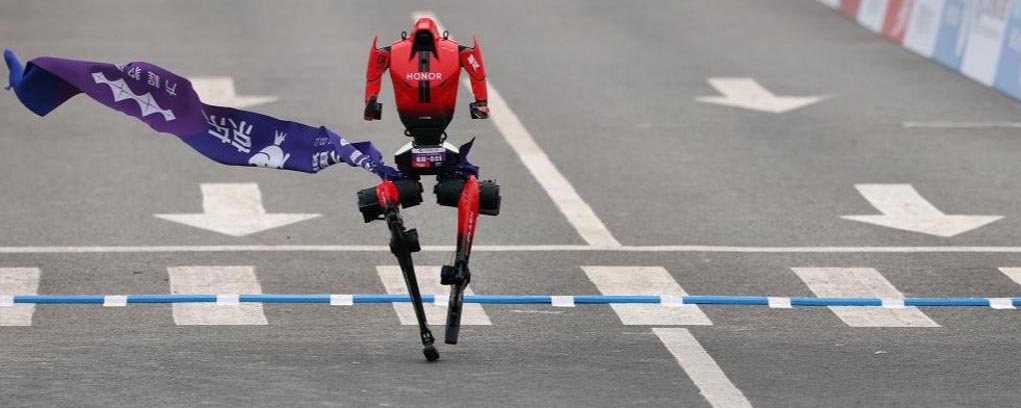
Robot Wins Beijing Half Marathon
6 Min. Read Time
Key News
Asian equities were largely higher despite the ongoing turbulence in the Middle East as the US dollar rallied overnight.
Bloomberg is reporting that China's imports of US soybeans increased to 1.8 million tons in March, which is higher than Brazilian imports of 1.4 million tons. It seems smart to increase purchases before next month’s Trump-Xi meeting.
Following last week’s IMF conference, government meetings in China focused on the structural issues weighing on domestic consumption such as the lack of a social safety net. While China was prepared for an oil and natural gas supply shock due to large inventories, the consensus was that it would cause only short-term inflation. The high prices appear to be lasting longer than expected. I suspect higher commodity prices will lead to higher producer price indexes (PPIs), which we saw in March, again in April. That could lead firms to pass those costs along to consumers.
Hong Kong and Mainland China both posted gains, though returns did not quite match Friday’s rally in US listings. Growth stocks and banks outperformed in Hong Kong, while oil and gas fell in both markets.
Tencent gained +2.35%, and was Hong Kong’s most heavily traded stock by value and a beneficiary of a large call option trade, as the company announced a joint venture with China Gas on cloud and AI infrastructure. Alibaba gained +0.44%, and was Hong Kong’s second-most heavily traded stock by value, on the early release of its updated AI large language model (LLM), which is called Qwen3.6-Max. Meituan fell -1.56% and JD.com fell -0.16%, as investors seemed to view Friday’s fines as a negative, though I am more focused on the benefits of reduced competition subsidies and a potential increase in net income and earnings per share (EPS).
Mainland investors sold a net -$499 million worth of Hong Kong-listed ETFs via Southbound Stock Connect, though selling was concentrated in the Hong Kong Tracker ETF. Mainland China’s rally was led by growth stocks, including technology hardware, and banks, though CATL fell -2.63%.
Mainland-listed solar names were largely higher, as Sungrow gained +1.85%, LONGi Green Energy gained +1.20%, and Jinko Solar was flat. Polycrystalline silicon futures jumped 9% on another official announcement on addressing overcapacity and overproduction. Polycrystalline silicon futures had given up all of their gains following last early July’s announcements on addressing overcapacity, which has left the global leaders profitless. Massive inventories have built up, as demand has not matched supply. The industry did not seem to pay much attention to the government’s instructions.
The 1 and 5-Year Loan Prime Rates (LPRs) were left unchanged, as expected, at 3% and 3.5%, respectively.
Zheng Gangjie of the National Development & Reform Commission (NDRC) met with private companies from several industries, including automakers, in order to hear their opinions on the economy.
The National Energy Administration reported that electricity consumption increased +3.5% year-over-year (YoY) to 859.5 billion kilowatt-hours, while Q1 electricity consumption increased +5.2% YoY to 2.61 trillion kilowatt-hours.
This weekend’s Beijing half-marathon (21-kilometer) race included robot participants. Evidence of Moore’s Law was apparent as this year’s winner, from cell phone maker Honor, completed the race in 50 minutes and 26 seconds versus last year’s winner X-Humanoid’s Tiangong Ultra, which took 2 hours and 40 minutes, according to Yicai. For a human comparison, Uganda’s Jacob Kiplimo recently set the half marathon record at 57 minutes and 20 seconds.
It was equally impressive that the top three robotic runners were utilizing autonomous navigation, i.e. not remote control. China Daily reported that “40 percent of the teams competed autonomously, with their robots relying entirely on sensors, cameras and other devices to perceive their surroundings in real time, and independently completing a series of complex tasks such as localization, mapping, path planning and dynamic obstacle avoidance.” China is leading in robotics worldwide, and the Beijing Half Maraton is a testament to capabilities developed locally. According to the same article,14,000 of the 17,000 humanoid robots sold in 2025, more than 80% of the total, were produced by China-based firms.
Last Night's Performance
| Country / Index | Ticker | 1-Day Change |
|---|---|---|
| China (Hong Kong) | HSI Index | 0.8% |
| Hang Seng Tech | HSTECH Index | 0.5% |
| Hong Kong Turnover | HKTurn Index | 1.4% |
| Hong Kong Short Sale Turnover | HKSST Index | -18.5% |
| Short Turnover as a % of Hong Kong Turnover | N/A | 16.6% |
| Southbound Stock Connect Net Buy/Sell (US $ Millions) | N/A | -499.27 |
| China (Shanghai) | SHCOMP Index | 0.8% |
| China (Shenzhen) | SZCOMP Index | 0.7% |
| China (STAR Board) | Star50 Index | 1.9% |
| Mainland Turnover | .chturn Index | 6.3% |
| Japan | NKY Index | 0.6% |
| India | SENSEX Index | 0% |
| Indonesia | JCI Index | -0.5% |
| Malaysia | FBMKLCI Index | 0.4% |
| Pakistan | KSE100 Index | -1% |
| Philippines | PCOMP Index | 0.3% |
| South Korea | KOSPI Index | 0.4% |
| Taiwan | TWSE Index | 0.4% |
| Thailand | SET Index | 0% |
| Singapore | STI Index | 0.1% |
| Australia | AS51 Index | 0.1% |
| Vietnam | VNINDEX Index | 1.1% |
| Indicator | Hong Kong | Mainland China |
|---|---|---|
| Today's Volume % of 1-Year Average | 94 | 128 |
| Advancing Stocks | 300 | 2942 |
| Declining Stocks | 199 | 2030 |
| Outperforming Factors | Buyback, Quality, Value | Liquidity, Growth, Momentum |
| Underperforming Factors | EPS Revision, Momentum | EPS Revision |
| Top Sectors | Communication, Staples, Tech | Tech, Utilities, Financials |
| Bottom Sectors | Energy, Healthcare, Discretionary | Real Estate, Energy |
| Top Subsectors | Paper/Packaging, Software, Food | Chemical Fiber, Aerospace, Heavy Machinery |
| Bottom Subsectors | Petroleum/Petrochemical, Coal, Auto | Motorcycle, Energy Equipment, Pharmaceuticals |
| Southbound Connect Buys | CNOOC, Pop Mart (Moderate), SMIC, YOFC (Small) | N/A |
| Southbound Connect Sells | HK Tracker ETF (Very Large), HS Tech ETF (Large) | N/A |
| MSCI China All Shares Index | # of Stocks | Average 1-Day Change (%) |
|---|---|---|
| Hong Kong Listed | 164 | 0.83 |
| Communication Services | 11 | 2.02 |
| Consumer Discretionary | 28 | -0.07 |
| Consumer Staples | 12 | 1.83 |
| Energy | 6 | -2.22 |
| Financials | 25 | 1.57 |
| Health Care | 16 | -0.73 |
| Industrials | 19 | 0.14 |
| Information Technology | 15 | 1.7 |
| Materials | 14 | 0.15 |
| Real Estate | 1 | 0.04 |
| Utilities | 6 | 1.44 |
| Mainland China Listed | 11 | 0.76 |
| Communication Services | 11 | 0.73 |
| Consumer Discretionary | 26 | 0.52 |
| Consumer Staples | 18 | 0.18 |
| Energy | 11 | -0.36 |
| Financials | 64 | 0.89 |
| Health Care | 29 | 0.17 |
| Industrials | 60 | 0.23 |
| Information Technology | 113 | 1.75 |
| Materials | 58 | 0.01 |
| US & Hong Kong Dually Listed | Ticker | 1-Day Change (%) |
|---|---|---|
| Tencent HK | 700 HK Equity | 2.4 |
| Alibaba HK | 9988 HK Equity | 0.4 |
| JD.com HK | 9618 HK Equity | -0.2 |
| NetEase HK | 9999 HK Equity | 0.8 |
| Yum China HK | 9987 HK Equity | 1.9 |
| Baozun HK | 9991 HK Equity | -0.1 |
| Baidu HK | 9888 HK Equity | 0.7 |
| Autohome HK | 2518 HK Equity | 0.8 |
| Bilibili HK | 9626 HK Equity | 0.2 |
| Trip.com HK | 9961 HK Equity | -1 |
| EDU HK | 9901 HK Equity | -0.7 |
| Xpeng HK | 9868 HK Equity | -0.4 |
| Weibo HK | 9898 HK Equity | -0.2 |
| Li Auto HK | 2015 HK Equity | 2.6 |
| Nio Auto HK | 9866 HK Equity | -2.3 |
| Zhihu HK | 2390 HK Equity | 3.1 |
| KE HK | 2423 HK Equity | -0.5 |
| Tencent Music Entertainment HK | 1698 HK Equity | -0.2 |
| Meituan HK | 3690 HK Equity | -1.6 |
| Hong Kong's Most Heavily Traded by Value | 1-Day Change (%) |
|---|---|
| TENCENT HOLDINGS LTD | 2.4 |
| ALIBABA GROUP HOLDING LTD | 0.4 |
| YANGTZE OPTICAL FIBRE AND-H | 2.4 |
| CNOOC LTD-H | -2.4 |
| XIAOMI CORP-CLASS B | 1 |
| MANYCORE TECH INC | 101.3 |
| POP MART INTERNATIONAL GROUP | 1.1 |
| SEMICONDUCTOR MANUFACTURI-H | 0.8 |
| MEITUAN-CLASS B | -1.6 |
| CHINA CONSTRUCTION BANK-H | 2.3 |
| Shanghai and Shenzhen's Most Heavily Traded by Value | 1-Day Change (%) |
|---|---|
| LUXSHARE PRECISION INDUSTR-A | 10 |
| ZHONGJI INNOLIGHT CO LTD-A | -0.1 |
| CONTEMPORARY AMPEREX TECHN-A | -2.6 |
| EOPTOLINK TECHNOLOGY INC L-A | -1 |
| VICTORY GIANT TECHNOLOGY -A | 5.1 |
| SUZHOU DONGSHAN PRECISION-A | -3.1 |
| BLUEFOCUS INTELLIGENT COMM-A | 8.5 |
| SUZHOU TFC OPTICAL COMMUNI-A | -1.3 |
| HENGTONG OPTIC-ELECTRIC CO-A | 9.4 |
| FOXCONN INDUSTRIAL INTERNE-A | 0.9 |
Last Night's Exchange Rates, Prices, & Yields
- CNY per USD 6.82 versus 6.82 yesterday
- CNY per EUR 8.02 versus 8.03 yesterday
- Yield on 10-Year Government Bond 1.76% versus 1.76% yesterday
- Yield on 10-Year China Development Bank Bond 1.84% versus 1.86% yesterday
- Copper Price 0.57%
- Steel Price 0.61%
KraneShares China ETF News delivers the latest news, insights, and analysis on the key drivers shaping China’s capital markets and China ETFs. As a pioneer in the China ETF market for over a decade, KraneShares provides investors with innovative access to China’s fastest-growing sectors, including technology, artificial intelligence (AI), internet, renewable energy, electric vehicles, humanoid robotics, and healthcare.
Explore our full range of U.S.-listed China ETFs designed to help investors access China’s evolving economy and long-term growth opportunities. View the full KraneShares China ETF list.