Tencent’s AI Capital Expenditure Exceeds Expectations

6 Min. Read Time

Key News

Asian equities were largely lower except for Korea, which rebounded post-Nvidia’s earnings results. 

While Mainland China was able to rebound intraday, led by the AI supply chain with help from the National Team (i.e., investment firms associated with sovereign wealth), Hong Kong took another leg lower, nearing October lows. China's volumes were light, as it was the lowest-volume day in a year. That’s amazing considering volumes are usually light before a holiday. Potentially an indication that retail or margin investors have been carried out.

JD.com fell by -7.18% after yesterday’s in-line and higher earnings results, with some citing today’s weakness on an uncertain outlook. JD.com's move lower cast a cloud over other E-Commerce companies: Tencent fell -0.85%, Alibaba fell -0.23%, NetEase fell -0.79%, Trip.com fell -1.16%, and Baidu fell -0.99%. AI large language model (LLM) stocks, including Z.AI (+9.61%) and Minimax (+4.4%), rose after yesterday’s bloodbath.

Tencent Music gained +6.39% after yesterday’s results. Mainland investors bought $350 million of Hong Kong stocks today via Southbound Stock Connect. While breadth was poor in both markets, large-cap stocks helped the Mainland market minimize the downdraft. Oil and gas, telecommunications, and AI supply chain stocks (semiconductor, semiconductor equipment, electronic components, and communications) outperformed, while non-ferrous metals, liquor, and healthcare underperformed.

The Mainland-listed China equity ETFs utilized by China's "National Team" were higher across the mid-cap, small-cap, STAR Board, and Shenzhen-focused ETFs, while the large-cap ETFs had mixed volume. The one ETF exceeding the RMB 10 billion value traded mark was a Shenzhen-focused ETF, though a STAR-focused ETF was just shy of the level. On Tuesday (data is a day lag, T+1), these favored ETFs saw a healthy $3.183 billion in net inflows. Remember, these ETFs experienced net outflows last week, indicating policy support.

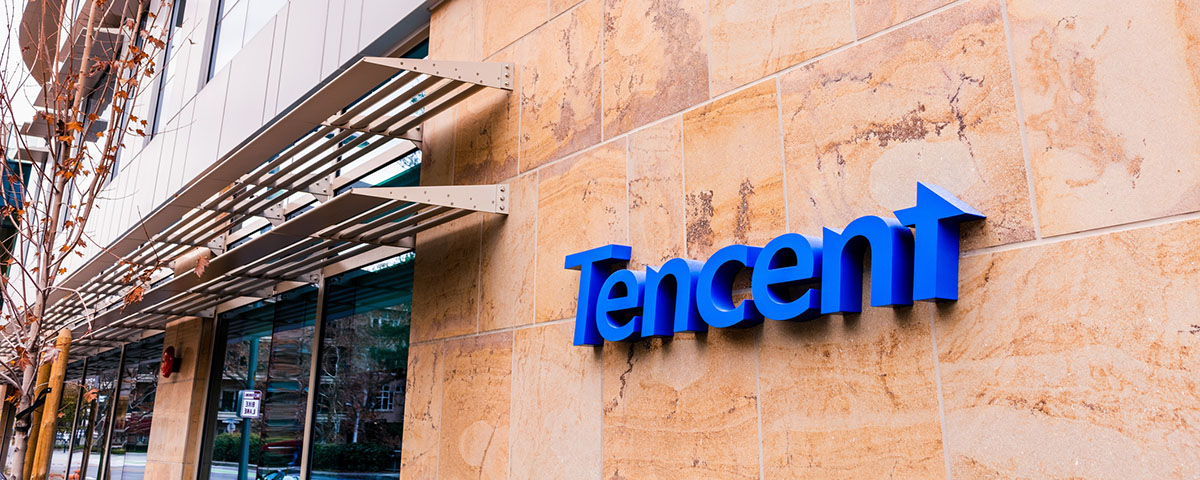
Tencent reported Q3 financial results after the Hong Kong close that missed on revenue and adjusted net income, while adjusted EPS beat analyst expectations. Going into the results, the big unknown was the extent AI capex would weigh on the bottom line. Q3 capex was far higher than anticipated at RMB 81.43 billion versus expectations of RMB 55.4 billion, while free cash flow was a negative RMB -69.1 billion. While Adjusted Net Income declined by -6% year-over-year (YoY), Tencent’s significant buyback of 15.9 million shares limited its EPS’ decline to -1% YoY.

  • Revenue increased +8% YoY to RMB 207.3 billion from RMB 192.9 billion versus expectations of RMB 210.5 billion.
  • Adjusted Net Income declined by -6% to RMB 66.52 billion from RMB 70.55 billion versus expectations of RMB 66.5 billion.
  • Adjusted EPS declined by -1% to RMB 7.23 from RMB 7.58 versus expectations of RMB 7.30.

President Xi gave a keynote speech at the APEC Business Leaders Summit in Shenzhen. He highlighted and used the term “Promote common prosperity in the Asia-Pacific region” to introduce areas of mutual benefit across trade, innovation, cooperation, peace, and stability. The term likely gave a few folks shivers, though the speech was very warm, friendly, and welcoming. President Xi also met President Trump at the Shenzhen airport for tomorrow’s APEC meeting.

Last Night's Performance

China (STAR Board) shines as Asia slips broadly

6 of 17 markets were up; China (STAR Board) was the standout gainer.

+2.2%
STAR Board (best)
-1.4%
Vietnam (worst)
+351
Southbound Connect (US$ mn)
MarketChange1-Day
China (STAR Board)
STAR50 Index
+2.2%
South Korea
KOSPI Index
+2.0%
Japan
NKY Index
+0.3%
Taiwan
TWSE Index
+0.3%
Philippines
PCOMP Index
+0.2%
China (Shanghai)
SHCOMP Index
+0.1%
Thailand
SET Index
-0.2%
China (Shenzhen)
SZCOMP Index
-0.3%
Malaysia
FBMKLCI Index
-0.5%
Hang Seng Tech
HSTECH Index
-0.6%
India
SENSEX Index
-0.6%
Pakistan
KSE100 Index
-0.7%
Australia
AS51 Index
-0.7%
China (Hong Kong)
HSI Index
-0.9%
Indonesia
JCI Index
-1.1%
Singapore
STI Index
-1.1%
Vietnam
VNINDEX Index
-1.4%
Hong Kong and Mainland China Liquidity (1-Day Change)
Hong Kong Turnover
HKTurn Index
-10.6%
Hong Kong Short Sale Turnover
HKSST Index
-5.6%
Short Turnover as % of HK Turnover
20.00%
Southbound Connect Net Buy/Sell (US$ mn)
+351
Mainland Turnover
.CHTURN Index
-6.1%

Utilities, Tech lead Hong Kong; Tech, Energy lead Mainland China sectors

218 / 335
HK Advancing / Declining
1,286 / 3,762
Mainland Advancing / Declining
IndicatorHong KongMainland China
Volume % of 1-Year Average69%58%
Advancing / Declining218 / 3351,286 / 3,762
Outperforming Factors—MomentumEPS RevisionLiquidity
Underperforming FactorsBuybackGrowthESG ScoreBuybackValueQuality
Top SectorsUtilitiesTechIndustrialsTechEnergyUtilities
Bottom SectorsMaterialsStaplesHealthcareMaterialsReal EstateHealthcare
Top SubsectorsSemisEnvironmental ProtectionTech HardwareComputer HardwareMarineInternet
Bottom SubsectorsConsumer Staples DistributionNon Ferrous MetalPharmaceuticals/BiotechPrecious MetalsAerospace/MilitaryChemical Fiber
Southbound Connect BuysTencent (Large), Hua Hong Semi, SMIC (Moderate), Alibaba, YOFC (Small)—
Southbound Connect SellsCNOOC (Small)—

Mainland China advances while Hong Kong softens

-0.82%
Hong Kong listed (152)
+0.30%
Mainland listed (419)
Sector# StocksChangeAvg. 1-Day
Hong Kong Listed · 152 stocks-0.82%
Utilities10
+1.20%
Information Technology14
+1.12%
Industrials16
+0.59%
Energy7
-0.33%
Financials24
-0.75%
Consumer Discretionary27
-0.80%
Communication Services7
-0.83%
Real Estate6
-1.06%
Health Care15
-1.70%
Consumer Staples12
-3.01%
Materials14
-4.57%
Mainland China Listed · 419 stocks+0.30%
Information Technology126
+2.18%
Energy11
+1.17%
Industrials62
+0.47%
Consumer Discretionary21
-0.08%
Financials60
-0.26%
Communication Services9
-0.37%
Consumer Staples16
-0.85%
Health Care26
-0.90%
Materials69
-1.70%

US & Hong Kong Dually Listed

3 / 14
Up / Down (2 flat)
+6.4%
Tencent Music Ent. (best)
-7.2%
JD.com (worst)
CompanyChange1-Day
Tencent Music Ent.
1698 HK Equity
+6.4%
Xpeng
9868 HK Equity
+3.3%
Nio
9866 HK Equity
+2.2%
Baozun
9991 HK Equity
0.0%
Li Auto
2015 HK Equity
0.0%
Alibaba
9988 HK Equity
-0.2%
Yum China
9987 HK Equity
-0.5%
New Oriental (EDU)
9901 HK Equity
-0.5%
Meituan
3690 HK Equity
-0.5%
NetEase
9999 HK Equity
-0.8%
Tencent
700 HK Equity
-0.9%
Baidu
9888 HK Equity
-1.0%
Trip.com
9961 HK Equity
-1.2%
KE Holdings
2423 HK Equity
-1.2%
Autohome
2518 HK Equity
-1.9%
Zhihu
2390 HK Equity
-2.0%
Bilibili
9626 HK Equity
-2.3%
Weibo
9898 HK Equity
-4.9%
JD.com
9618 HK Equity
-7.2%

Z AI surges +9.6% among Hong Kong's most-traded stocks

Value Traded Rank · CompanyChange1-Day
1Tencent Holdings
-0.9%
2Alibaba Group
-0.2%
3Hua Hong Semiconductor
+3.8%
4SMIC
0.0%
5Zijin Mining
-6.1%
6Xiaomi Corp
-0.1%
7Z AI
+9.6%
8Meituan
-0.5%
9JD Health International
-15.4%
10JD.com
-7.2%

WUS Printed Circuit (Kunshan) surges +10.0% among Shanghai & Shenzhen's most-traded stocks

Value Traded Rank · CompanyChange1-Day
1Zhongji Innolight
+0.8%
2Eoptolink Technology
-1.1%
3Cambricon Technologies
+4.9%
4Suzhou Dongshan Precision
+0.1%
5CXMT
+2.0%
6Zijin Mining
-5.7%
7WUS Printed Circuit (Kunshan)
+10.0%
8Hua Hong Semiconductor
+7.3%
9Contemporary Amperex
+1.1%
10Foxconn Industrial Internet
+5.7%

Last Night's Exchange Rates, Prices, & Yields

  • CNY per USD 6.66 versus 6.66 yesterday
  • CNY per EUR 7.31 versus 7.33 yesterday
  • Yield on 10-Year Government Bond 1.58% versus 1.63% yesterday
  • Yield on 10-Year China Development Bank Bond 1.70% versus 1.69% yesterday