Tencent’s AI Efforts Rewarded (Finally!)
5 Min. Read Time
Key News
Flaring Middle East tensions, today’s US CPI release, and Oracle financial results weighed on Asian equities. AI "picks and shovels" stocks in Korea, Japan, Taiwan, Mainland China’s Science and Technology (STAR) Board, and Indonesia underperformed.
There was another flip-flop from yesterday: value outperformed in Hong Kong, while Hong Kong-listed electrical equipment stocks were lower, with CATL down by -5.43%. Hardware, electronic equipment, and semiconductors were the hardest-hit sectors in Hong Kong.
It was a similar setup in Mainland China, as value sectors outperformed while technology hardware, electronic equipment, communication equipment, semiconductors, and electrical equipment stocks were all lower, though semiconductor equipment and materials stocks all held up.
Yesterday’s Bloomberg article on China’s AI data center build-out was noted in Mainland financial media, though it clearly had no effect and was not viewed as credible. Both markets managed to rise off of intra-day lows, which was a small positive.
Mainland investors bought the Hong Kong dip via Southbound Stock Connect, as the Hong Kong Tracker ETF saw a net buy of $517 million (HKD 4 billion). Meanwhile, Tencent gained +2.74% and recorded a net buy of $254mm (HKD 1.99 billion), Alibaba fell =2.22% and recorded a large net sell.
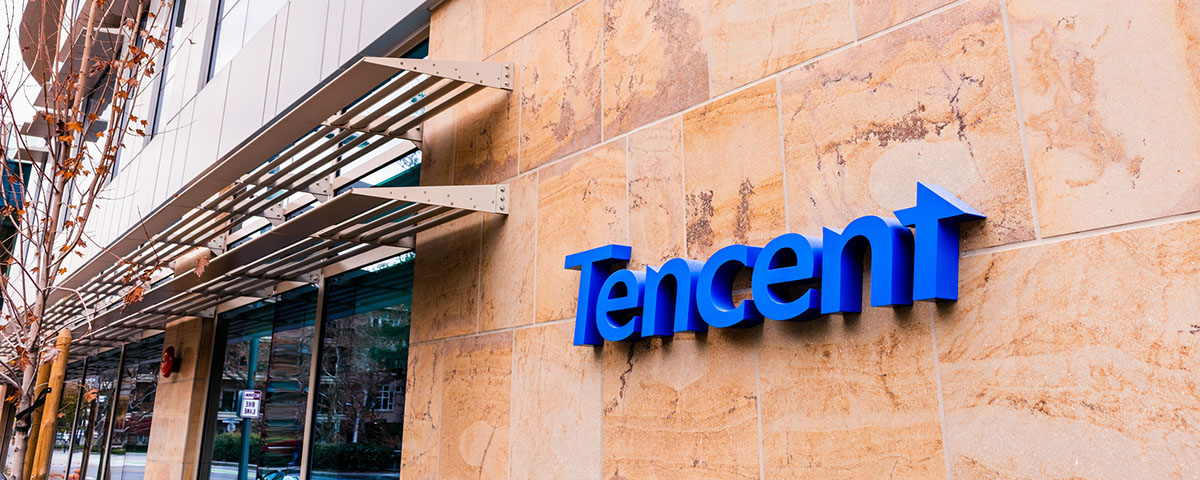
Tencent’s incorporation of AI into WeChat is finally hitting investors' radar! The path to monetization is happening. Tencent also benefited from strong investor interest after raising $4.7 billion to fund AI efforts. The company continues to buy back shares, as well.
Lenovo fell by -9.38% on profit-taking, despite price increases, as AI demand lifts the Asian technology ecosystem.
Electric vehicle maker XPeng fell by -2.21% despite its CEO, He Xiaopeng, taking over the auto company’s humanoid robotic efforts.
The Ministry of Industry and Information Technology (MIIT) issued "Opinions on the Innovation and Development Implementation of Artificial Intelligence + Information Communication" following a conference focused on “expanding domestic demand, and promoting high-level self-reliance in science and technology”. We see policy support on the latter but not much on the former as tepid domestic consumption weighs on E-Commerce. Time to hit the consumption gas pedal IMO.
May PPI was up +3.9% versus expectations of 3.9% and April’s 2.8%. CPI was 1.2% versus expectations of 1.3% and April’s 1.2%. A little inflation in China isn’t a bad thing, though China arguably is exporting an element of inflation globally, as evidenced by yesterday's strong export data, as higher commodity prices lift import prices. Higher input costs lead to higher output costs.
It was shocking to me that there was little coverage of the 618 E-Commerce sales event, which is an indication of how out of sight/out of favor the space is.
Last Night's Performance
| Country / Index | Ticker | 1-Day Change |
|---|---|---|
| China (Hong Kong) | HSI Index | -0.6% |
| Hang Seng Tech | HSTECH Index | -0.9% |
| Hong Kong Turnover | HKTurn Index | 3.8% |
| Hong Kong Short Sale Turnover | HKSST Index | 3.5% |
| Short Turnover as a % of Hong Kong Turnover | N/A | 19.2% |
| Southbound Stock Connect Net Buy/Sell (US $ Millions) | N/A | 1,052.79 |
| China (Shanghai) | SHCOMP Index | -0.4% |
| China (Shenzhen) | SZCOMP Index | -2% |
| China (STAR Board) | Star50 Index | -0.7% |
| Mainland Turnover | .chturn Index | -0.9% |
| Japan | NKY Index | -1.9% |
| India | SENSEX Index | 0.1% |
| Indonesia | JCI Index | 2.7% |
| Malaysia | FBMKLCI Index | 0.2% |
| Pakistan | KSE100 Index | -0.5% |
| Philippines | PCOMP Index | -0.1% |
| South Korea | KOSPI Index | -4.5% |
| Taiwan | TWSE Index | -3.3% |
| Thailand | SET Index | -1.3% |
| Singapore | STI Index | -1.3% |
| Australia | AS51 Index | 0.6% |
| Vietnam | VNINDEX Index | 0.6% |
| Indicator | Hong Kong | Mainland China |
|---|---|---|
| Today's Volume % of 1-Year Average | 128% | 127% |
| Advancing Stocks | 248 | 1355 |
| Declining Stocks | 258 | 3725 |
| Outperforming Factors | Quality, Value, Low Volatility | Value, Low Volatility, Dividend Yield |
| Underperforming Factors | Momentum, EPS Revision, Liquidity | Momentum, Growth, Liquidity |
| Top Sectors | Communication, Healthcare, Financials | Financials, Healthcare, Staples |
| Bottom Sectors | Tech, Industrials, Materials | Tech, Industrials, Energy |
| Top Subsectors | Paper/Packaging, Consumer Durables/Apparel, Pharmaceuticals/Biotech | Insurance, Catering/Tourism, Banking |
| Bottom Subsectors | HK Electrical Equipment, Tech Hardware, Semis | Construction Machinery, Communication Equipment, Power Generation |
| Southbound Connect Buys | HK Tracker ETF (Very Large), Tencent, YOFC (Large), KB Laminates, Xiaomi (Moderate), HS Tech ETF (Small) | N/A |
| Southbound Connect Sells | Alibaba (Large), CNOOC (Small) | N/A |
| MSCI China All Shares Index | # of Stocks | Average 1-Day Change (%) |
|---|---|---|
| Hong Kong Listed | 165 | 0.07 |
| Communication Services | 11 | 2.63 |
| Consumer Discretionary | 28 | -0.93 |
| Consumer Staples | 13 | 0.76 |
| Energy | 6 | -1.25 |
| Financials | 25 | 1.15 |
| Health Care | 16 | 1.43 |
| Industrials | 22 | -2.97 |
| Information Technology | 12 | -4.3 |
| Materials | 14 | -2.6 |
| Real Estate | 7 | 0.93 |
| Utilities | 11 | -1.02 |
| Mainland China Listed | 386 | -1.14 |
| Communication Services | 8 | -0.96 |
| Consumer Discretionary | 26 | -1.38 |
| Consumer Staples | 19 | 1.04 |
| Energy | 12 | -2.04 |
| Financials | 64 | 1.39 |
| Health Care | 31 | 1.25 |
| Industrials | 58 | -2.49 |
| Information Technology | 95 | -2.54 |
| Materials | 52 | -1.18 |
| US & Hong Kong Dually Listed | Ticker | 1-Day Change (%) |
|---|---|---|
| Tencent HK | 700 HK Equity | 2.7 |
| Alibaba HK | 9988 HK Equity | -2.2 |
| JD.com HK | 9618 HK Equity | -1.6 |
| NetEase HK | 9999 HK Equity | 3.8 |
| Yum China HK | 9987 HK Equity | 1.7 |
| Baozun HK | 9991 HK Equity | -1.8 |
| Baidu HK | 9888 HK Equity | 0.1 |
| Autohome HK | 2518 HK Equity | -0.5 |
| Bilibili HK | 9626 HK Equity | 2.1 |
| Trip.com HK | 9961 HK Equity | 2.4 |
| EDU HK | 9901 HK Equity | 1 |
| Xpeng HK | 9868 HK Equity | -2.9 |
| Weibo HK | 9898 HK Equity | 0 |
| Li Auto HK | 2015 HK Equity | -2.1 |
| Nio Auto HK | 9866 HK Equity | -7.1 |
| Zhihu HK | 2390 HK Equity | -1.1 |
| KE HK | 2423 HK Equity | -0.1 |
| Tencent Music Entertainment HK | 1698 HK Equity | -0.2 |
| Meituan HK | 3690 HK Equity | 2.3 |
| Hong Kong's Most Heavily Traded by Value | 1-Day Change (%) |
|---|---|
| TENCENT HOLDINGS LTD | 2.7 |
| ALIBABA GROUP HOLDING LTD | -2.2 |
| SEMICONDUCTOR MANUFACTURI-H | -3.5 |
| XIAOMI CORP-CLASS B | -3.2 |
| LENOVO GROUP LTD | -9.4 |
| HUA HONG GRACE SEMICONDUCTOR | -2 |
| YANGTZE OPTICAL FIBRE AND-H | -9.4 |
| HSBC HOLDINGS PLC | -4.8 |
| MEITUAN-CLASS B | 2.3 |
| AIA GROUP LTD | -1.1 |
| Shanghai and Shenzhen's Most Heavily Traded by Value | 1-Day Change (%) |
|---|---|
| ZHONGJI INNOLIGHT CO LTD-A | -2.8 |
| EOPTOLINK TECHNOLOGY INC L-A | -1.7 |
| HENGTONG OPTIC-ELECTRIC CO-A | 1.8 |
| BOE TECHNOLOGY GROUP CO LT-A | -7.5 |
| JIANGSU ZHONGTIAN TECHNOLO-A | -7.9 |
| HYGON INFORMATION TECHNOLO-A | 6.2 |
| SUZHOU TFC OPTICAL COMMUNI-A | -7.4 |
| CAMBRICON TECHNOLOGIES-A | -3.1 |
| GIGADEVICE SEMICONDUCTO-CL A | -3.9 |
| SUZHOU DONGSHAN PRECISION-A | -5.4 |
Last Night's Exchange Rates, Prices, & Yields
- CNY per USD 6.77 versus 6.77 yesterday
- CNY per EUR 7.83 versus 7.83 yesterday
- Yield on 10-Year Government Bond 1.75% versus 1.74% yesterday
- Yield on 10-Year China Development Bank Bond 1.81% versus 1.80% yesterday
- Copper Price +0.07%
- Steel Price +0.54%