VAT Rumors Weigh On Internet Stocks
6 Min. Read Time
Key News
Asian equities rebounded strongly, led by Japan, Taiwan, South Korea, and India. The US dollar was weak overnight, as China's currency, the Renminbi (CNY), hit another 52-week high against the US dollar, closing at 6.93 CNY per USD.
While Mainland China stocks were higher, Hong Kong stocks opened higher but quickly retreated due to a rumor. There was a rumor that E-Commerce and online video gaming companies could be subject to a value-added tax (VAT) increase, as we saw in the telecommunication sector recently, which led to a wholesale mid-morning collapse.
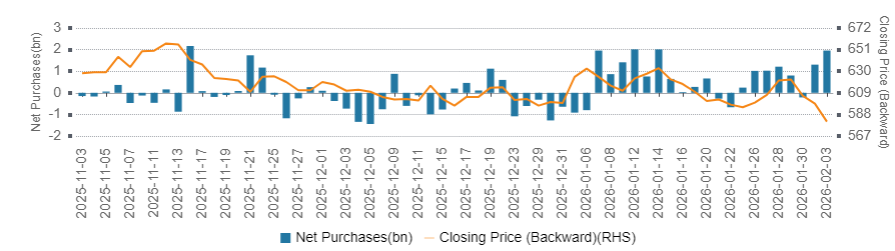
Bearing the brunt of the downdraft was Tencent, which fell -2.92%, though it bounced off mid-morning lows of -6.27% on exceedingly high volumes, nearly 3X the 1-year average. Mainland investors were large net buyers of Tencent via Southbound Stock Connect. It was shocking that a rumor could wipe HKD 159 billion ($20 billion) of the market cap of an exceedingly well-respected company, though it shows how quick investors are with their trigger finger when it comes to China and regulation in the same sentence.
The rumor hit the majority of internet stocks as Alibaba closed down -1.41% (-4.96% was the intra-day low), Kuaishou down -4.61% (-7.73% was the intra-day low), Meituan down -1.74% (-3.90% was the intra-day low), Baidu down -3.61% (-6.82% was the intra-day low), and Bilibili down -2.40% (-7.40% was the intra-day low). There was also some chatter about AI price wars, which may have aslo weighed on the names.
In addition to weakness in the banking and telecommunications sectors, several growth stocks were weaker, including BYD, which fell -1.10%, Contemporary Amperex (CATL), which fell -1.03%, Semiconductor Manufacturing International (SMIC), which fell -2.42%, and Xiaomi, which fell -1.31%.
Hong Kong-listed stocks in other sectors had a very broad rally, though, led by a rebound in non-ferrous metals. Mainland China futures rebounded, along with gold, silver, platinum, palladium, and copper. Mainland Chinese equities had a very broad rally, except for the bank and oil stocks.
Shockingly, we had another rumor hit the Mainland-listed Cambricon, as the stock fell -9.18%, that the company had significantly lowered its 2026 revenue guidance. The company’s lunchtime denial lifted the stock off an intra-day low of -14.41%. Shareholders appear to be quick with their trigger finger after banking huge paper gains of +97% in the last year and +939% in the last two years. It was a very quiet day overall, except for the rumors that took the wind out of what could have been a much stronger performance.
One factor in studying Mainland China is the consequences of its closed capital system, as domestic Chinese investors cannot easily diversify internationally at scale, or invest in Hong Kong stocks via Southbound Stock Connect. This is not unique to China, as India, Brazil, and South Africa have similar rules in spirit, broadly speaking. China-based investors have many stock investment options with over 5,000 listed companies, though growth companies aligned with government policies can drive momentum and overcrowding in a smaller subset of securities. This can lead to dramatic moves, as we saw with Cambricon today, and explains the strong performance over the last two years.
I was wondering whether US private equity investment is similarly concentrated in US opportunities, leading to high valuations exacerbated by geopolitics and the reality that the US produces many tech start-ups, i.e., American exceptionalism has justification. The trigger for this was Waymo’s latest fundraising round of nearly $110 billion, according to Bloomberg News. With 20 million rides in 2025 and 400,000 paid rides a week, the company is clearly making strides. Stepping back, Ford’s market cap is $55 billion, while BYD’s is $111 billion, though obviously it is not an apples-to-apples comparison. Baidu’s robotaxi Apollo Go provided 17 million rides and 250,000 paid rides a week in 2025. What should Apollo Go be valued at? It is difficult to say, but the market is not currently valuing the business at anywhere near $110 billion. Baidu’s total market cap is $52 billion!
Tencent’s Hong Kong Share Price & Net Buy/Sell Via Southbound Stock Connect
Last Night's Performance
| Country / Index | Ticker | 1-Day Change |
|---|---|---|
| China (Hong Kong) | HSI Index | 0.2% |
| Hang Seng Tech | HSTECH Index | -1.1% |
| Hong Kong Turnover | HKTurn Index | -3.7% |
| Hong Kong Short Sale Turnover | HKSST Index | 1.7% |
| Short Turnover as a % of Hong Kong Turnover | N/A | 16.4% |
| Southbound Stock Connect Net Buy/Sell (US $ Millions) | N/A | 121.61 |
| China (Shanghai) | SHCOMP Index | 1.3% |
| China (Shenzhen) | SZCOMP Index | 2.3% |
| China (STAR Board) | Star50 Index | 1.4% |
| Mainland Turnover | .chturn Index | -1.6% |
| Japan | NKY Index | 3.9% |
| India | SENSEX Index | 2.5% |
| Indonesia | JCI Index | 2.5% |
| Malaysia | FBMKLCI Index | 0.4% |
| Pakistan | KSE100 Index | 0.9% |
| Philippines | PCOMP Index | 1.7% |
| South Korea | KOSPI Index | 6.8% |
| Taiwan | TWSE Index | 1.8% |
| Thailand | SET Index | 1.1% |
| Singapore | STI Index | 1.1% |
| Australia | AS51 Index | 0.9% |
| Vietnam | VNINDEX Index | 0.4% |
| Indicator | Hong Kong | Mainland China |
|---|---|---|
| Today's Volume % of 1-Year Average | 128% | 137% |
| Advancing Stocks | 349 | 4580 |
| Declining Stocks | 130 | 487 |
| Outperforming Factors | Momentum, EPS Revisions, Growth | Momentum, Liquidity, Growth |
| Underperforming Factors | Low Volatility | |
| Top Sectors | Materials, industrials, Healthcare | Materials, Industrials, Staples |
| Bottom Sectors | Communication, Discretionary, Financials | Financials |
| Top Subsectors | Machinery, Steel, Non Ferrous Metal | Construction Machinery, Internet, Heavy Machinery |
| Bottom Subsectors | Media/Entertainment, Software/Services, Consumer Discretionary Distribution | Oil/Gas, Banking, Land Transport |
| Southbound Connect Buys | Tencent (Large), HS Tech ETF (Moderate), Meituan (Small) | |
| Southbound Connect Sells | HK Tracker ETF (Very Large), Alibaba, SMIC (Large), Kuiashou, YOFC (Small) |
| MSCI China All Shares Index | # of Stocks | Average 1-Day Change (%) |
|---|---|---|
| Hong Kong Listed | 165 | -0.54 |
| Communication Services | 11 | -2.79 |
| Consumer Discretionary | 28 | -0.64 |
| Consumer Staples | 13 | 0.21 |
| Energy | 6 | 0.35 |
| Financials | 25 | -0.04 |
| Health Care | 16 | 2.07 |
| Industrials | 22 | 2.07 |
| Information Technology | 12 | 0.08 |
| Materials | 14 | 4.32 |
| Real Estate | 7 | 1.04 |
| Utilities | 11 | 0.21 |
| Mainland China Listed | 386 | 1.52 |
| Communication Services | 8 | 1.63 |
| Consumer Discretionary | 26 | 1.42 |
| Consumer Staples | 19 | 1.95 |
| Energy | 12 | 0.68 |
| Financials | 64 | -0.32 |
| Health Care | 31 | 1.21 |
| Industrials | 58 | 2.32 |
| Information Technology | 95 | 1.78 |
| Materials | 52 | 3.69 |
| US & Hong Kong Dually Listed | Ticker | 1-Day Change (%) |
|---|---|---|
| Tencent HK | 700 HK Equity | -2.9 |
| Alibaba HK | 9988 HK Equity | -1.4 |
| JD.com HK | 9618 HK Equity | -0.7 |
| NetEase HK | 9999 HK Equity | 0.3 |
| Yum China HK | 9987 HK Equity | 2.1 |
| Baozun HK | 9991 HK Equity | -2 |
| Baidu HK | 9888 HK Equity | -3.6 |
| Autohome HK | 2518 HK Equity | 1.3 |
| Bilibili HK | 9626 HK Equity | -2.5 |
| Trip.com HK | 9961 HK Equity | 1.5 |
| EDU HK | 9901 HK Equity | 6.4 |
| Xpeng HK | 9868 HK Equity | -0.1 |
| Weibo HK | 9898 HK Equity | 0.1 |
| Li Auto HK | 2015 HK Equity | 1.9 |
| Nio Auto HK | 9866 HK Equity | -1.5 |
| Zhihu HK | 2390 HK Equity | 0.9 |
| KE HK | 2423 HK Equity | -0.4 |
| Tencent Music Entertainment HK | 1698 HK Equity | 0.4 |
| Meituan HK | 3690 HK Equity | -1.7 |
| Hong Kong's Most Heavily Traded by Value | 1-Day Change (%) |
|---|---|
| TENCENT HOLDINGS LTD | -2.9 |
| ALIBABA GROUP HOLDING LTD | -1.4 |
| SEMICONDUCTOR MANUFACTURI-H | -2.4 |
| KUAISHOU TECHNOLOGY | -4.6 |
| XIAOMI CORP-CLASS B | -1.3 |
| ZIJIN MINING GROUP CO LTD-H | 4.6 |
| MEITUAN-CLASS B | -1.7 |
| YANGTZE OPTICAL FIBRE AND-H | 12.2 |
| BYD CO LTD-H | -1.1 |
| POP MART INTERNATIONAL GROUP | 2.3 |
| Shanghai and Shenzhen's Most Heavily Traded by Value | 1-Day Change (%) |
|---|---|
| EOPTOLINK TECHNOLOGY INC L-A | -2.3 |
| CAMBRICON TECHNOLOGIES-A | -9.2 |
| ZHONGJI INNOLIGHT CO LTD-A | -0.2 |
| ZIJIN MINING GROUP CO LTD-A | 6 |
| BLUEFOCUS INTELLIGENT COMM-A | 3.2 |
| SUZHOU TFC OPTICAL COMMUNI-A | 13.2 |
| SHENZHEN SUNWAY COMMUNICAT-A | 13.1 |
| LEO GROUP CO LTD-A | 2.7 |
| ADDSINO CO LTD -A | 10 |
| TBEA CO LTD-A | 3.4 |
Last Night's Exchange Rates, Prices, & Yields
- CNY per USD 6.93 versus 6.94 yesterday
- CNY per EUR 8.18 versus 8.20 yesterday
- Yield on 10-Year Government Bond 1.82% versus 1.82% yesterday
- Yield on 10-Year China Development Bank Bond 1.97% versus 1.96% yesterday
- Copper Price -0.22%
- Steel Price -0.29%