Deflation Weighs On China’s Markets, Mainland Investors Buy Dip In Hong Kong
5 Min. Read Time
Key News
Asian equities were mixed but mostly lower overnight as the Philippines and Japan outperformed while Thailand and Hong Kong underperformed.
Both Hong Kong and Mainland China underperformed the region and lost some of their strong gains from last week. However, Mainland investors bought the dip in Hong Kong intensively, pouring nearly $4 billion into Hong Kong-listed stocks and ETFs on the weakness. There was also a significant rotation into value from growth stocks, continuing what was happening on Friday. However, health care held up better than most growth sectors.
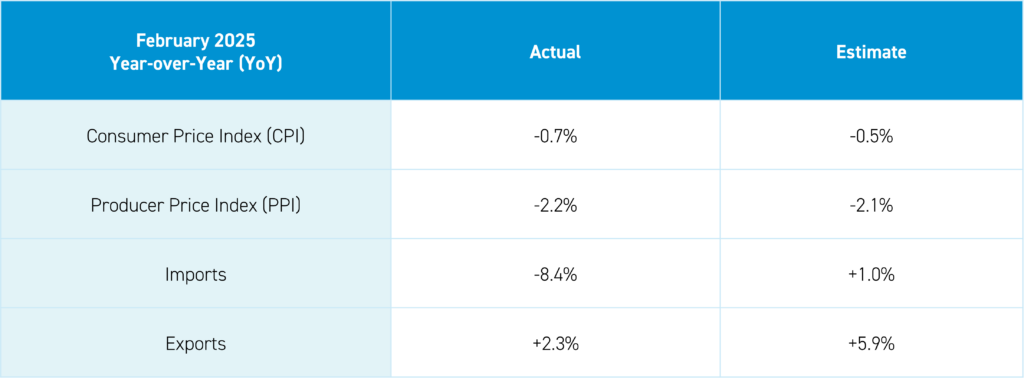
China's February inflation reading of -0.7% dinted confidence in the current market uptrend. However, there is a significant silver lining here: reversing deflation will require considerable consumer support. At the National People's Congress (NPC) in Beijing, which is still ongoing, policymakers discussed more consumer stimulus and support for the economy as top priorities. They even indicated a target inflation rate of 2%. Achieving this target would be a feat indeed, and suggests more stimulus than originally anticipated. Meanwhile, Trump's tariffs are also leading the central government to act more swiftly.
Trade data was weaker than expected as both imports and exports declined in February.
Yields on government have seen a slight uptick as stock momentum leads investors to own equities over stocks. We have been saying for months now that the equity risk premium (i.e. what you are paid for investing in stocks versus investing in bonds) in China has been at some of its highest levels in a decade. That gap is starting to close. This also means that policymakers will be more confident in CNY strength, making them better able to stimulate the economy.
Schools in Beijing and other tier-1 are said to be introducing more education to students around AI and the digital transformation. This reform to education could benefit names including TAL Education, which has become a premier education technology provider after shifting its focus from private tutoring.
Xpeng was featured at this year's National People's Congress (NPC) as the electric vehicle company announced that production of its flying car could begin as soon as 2026. Policymakers stressed the further development of autonomous driving systems, where Baidu leads, and humanoid robots.
The Hang Seng and Hang Seng Tech indexes both closed lower by -1.85% and -2.52%, respectively, on volume that decreased -21% from Friday. Mainland investors bought a net $3.8 billion worth of Hong Kong-listed stocks and ETFs overnight via Southbound Stock Connect. The top-performing sectors were Materials, which gained +0.38%, Energy, which gained +0.34%, and Heath Care, which gained +0.14%. Meanwhile, the worst-performing sectors were Communication Services, which fell -2.11%, Financials, which fell -1.14%, and Real Estate, which fell -0.96%.
Shanghai, Shenzhen, and the STAR Board all closed lower by -0.19%, -0.01%, and -0.22%, respectively. The top-performing sectors were Energy, which gained +0.75%; Materials, which gained +0.61%; and Industrials, which gained +0.28%. Meanwhile, the worst-performing sectors were Consumer Discretionary, which fell -3.45%, Health Care, which fell -2.62%, and Communication Services, which fell -2.50%.
| Country/Index | Ticker | 1-Day Change |
|---|---|---|
| China (Hong Kong) | HSI Index | -1.8% |
| Hang Seng Tech | HSTECH Index | -2.5% |
| Hong Kong Turnover | HKTurn Index | -21.2% |
| HK Short Sale Turnover | HKSST Index | -1.9% |
| Short Turnover as a % of HK Turnovr | N/A | 18.2% |
| Southbound Stock Connect Net Buy/Sell (US $ Millions) | N/A | 0 |
| China (Shanghai) | SHCOMP Index | -0.2% |
| China (Shenzhen) | SZCOMP Index | 0% |
| China (STAR Board) | Star50 Index | -0.2% |
| Mainland Turnover | .chturn Index | -17.2% |
| Nouthbound Stock Connect Net Buy/Sell (US $ Millions) | N/A | Not Available |
| Jing Daily China Global Luxury Index | CHINALUX Index | -1.3% |
| Japan | NKY Index | 0.4% |
| India | SENSEX Index | -0.3% |
| Indonesia | JCI Index | -0.6% |
| Malaysia | FBMKLCI Index | -0.7% |
| Pakistan | KSE100 Index | 0% |
| Philippines | PCOMP Index | 1% |
| South Korea | KOSPI Index | 0.3% |
| Taiwan | TWSE Index | -0.5% |
| Thailand | SET Index | -2% |
| Singapore | STI Index | -0.4% |
| Australia | AS51 Index | 0.2% |
| Vietnam | VNINDEX Index | 0.3% |
| MSCI China All Shares Index | # of Stocks | Average 1-Day Change (%) |
|---|---|---|
| Hong Kong Listed | 152 | -2.21 |
| Communication Services | 9 | -2.5 |
| Consumer Discretionary | 30 | -3.46 |
| Consumer Staples | 13 | -0.55 |
| Energy | 7 | 0.75 |
| Financials | 23 | -0.75 |
| Health Care | 13 | -2.62 |
| Industrials | 19 | 0.28 |
| Information Technology | 10 | -2.37 |
| Materials | 10 | 0.61 |
| Real Estate | 6 | -2.1 |
| Utilities | 12 | 0.04 |
| Mainland China Listed | 432 | -0.55 |
| Communication Services | 9 | -2.11 |
| Consumer Discretionary | 31 | -0.66 |
| Consumer Staples | 27 | -0.37 |
| Energy | 16 | 0.34 |
| Financials | 63 | -1.14 |
| Health Care | 40 | 0.14 |
| Industrials | 69 | -0.61 |
| Information Technology | 85 | -0.5 |
| Materials | 68 | 0.38 |
| Real Estate | 7 | -0.96 |
| Utilities | 17 | -0.64 |
| US & Hong Kong Dually Listed | Ticker | 1-Day Change (%) |
|---|---|---|
| Tencent HK | 700 HK Equity | -3.2 |
| Alibaba HK | 9988 HK Equity | -3.9 |
| JD.com HK | 9618 HK Equity | -4.6 |
| NetEase HK | 9999 HK Equity | 0.1 |
| Yum China HK | 9987 HK Equity | 0.9 |
| Baozun HK | 9991 HK Equity | -1.2 |
| Baidu HK | 9888 HK Equity | 1.3 |
| Autohome HK | 2518 HK Equity | 0.6 |
| Bilibili HK | 9626 HK Equity | -0.3 |
| Trip.com HK | 9961 HK Equity | -3.6 |
| EDU HK | 9901 HK Equity | 0.5 |
| Xpeng HK | 9868 HK Equity | -0.8 |
| Weibo HK | 9898 HK Equity | 1.7 |
| Li Auto HK | 2015 HK Equity | -0.4 |
| Nio Auto HK | 9866 HK Equity | 3 |
| Zhihu HK | 2390 HK Equity | -1.3 |
| KE HK | 2423 HK Equity | -1.6 |
| Tencent Music Entertainment HK | 1698 HK Equity | -2 |
| Meituan HK | 3690 HK Equity | -4.7 |
| Hong Kong's Most Heavily Traded by Value | 1-Day Change (%) |
|---|---|
| ALIBABA GROUP HOLDING LTD | -3.9 |
| TENCENT HOLDINGS LTD | -3.2 |
| XIAOMI CORP-CLASS B | -2.8 |
| MEITUAN-CLASS B | -4.7 |
| SEMICONDUCTOR MANUFACTURING | -4.7 |
| KUAISHOU TECHNOLOGY | -0.9 |
| XPENG INC - CLASS A SHARES | -0.8 |
| BYD CO LTD-H | -2.7 |
| JD.COM INC-CLASS A | -4.6 |
| HONG KONG EXCHANGES & CLEAR | -2 |
| Shanghai and Shenzhen's Most Heavily Traded by Value | 1-Day Change (%) |
|---|---|
| SHANGHAI STONEHILL TECHNOL-A | 1 |
| TALKWEB INFORMATION SYSTEM-A | -6.4 |
| CONTEMPORARY AMPEREX TECHN-A | -1.6 |
| INESA INTELLIGENT TECH INC-A | 1.8 |
| CAMBRICON TECHNOLOGIES-A | 3.9 |
| ZHEJIANG HAIKONG NANKE HUATI | -10 |
| CMOC GROUP LTD-A | 8.6 |
| ZHEJIANG DAHUA TECHNOLOGY-A | -2.4 |
| DHC SOFTWARE CO LTD -A | 1.8 |
| HAND ENTERPRISE SOLUTIONS-A | -8.3 |
Last Night's Exchange Rates, Prices, & Yields
- CNY per USD 7.26 versus 7.25 Friday
- CNY per EUR 7.87 versus 7.85 Friday
- Yield on 10-Year Government Bond 1.81% versus 1.80% Friday
- Yield on 10-Year China Development Bank Bond 1.84% versus 1.81% Friday
- Copper Price -0.32%
- Steel Price -0.49%