The Most Absurd Data Point You Will Read All Week
6 Min. Read Time
September Data Release
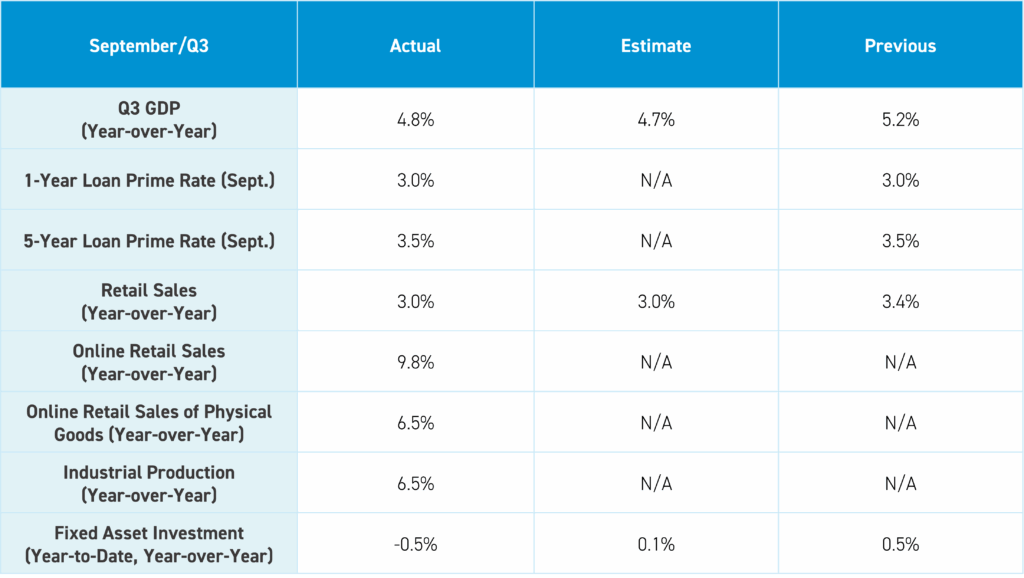
GDP data was a beat, though housing sales data weakness explains why China’s government should settle the trade war, so it can pivot to the real economic issues in China. New home prices fell -0.41% from August to September. Meanwhile, new home prices in first tier cities fell -0.3% month-over-month, led by Guangzhou, which saw prices fall -0.6%, and Shenzhen, which saw prices fall by -1.0%. Used home prices for September were also disappointing, falling -0.6% from August overall and -1.0% in first tier cities.
Key News
Asian equities were higher on easing US-China trade tensions less Malaysia and Vietnam while Singapore was closed for Diwali, the Hindu festival of lights.
There were several positives overnight, as President Trump’s comments were conciliatory and positive. China’s Ministry of Foreign Affairs spokesperson’s comments were, too. Treasury Secretary Bessent will meet Vice Premier He Lifeng this week in Malaysia, following a positive call on Friday, while Chinese trade negotiator Li Chenggang was removed from his post after Bessent called his August Washington DC meeting “unhinged”.
Growth stocks led Hong Kong higher, as Alibaba gained +4.86%, Tencent gained +3.21%, and Xiaomi gained +2.57%, as strong online retails sales likely helped Alibaba and JD.com.
Breadth was strong in both markets, though volumes were a touch light, as the Hang Seng Index closed just below 26,000. Hang Seng Tech Index was just below 6,000, while Shanghai and Shenzhen consolidated. A Mainland media headline reported that ETFs in China had ~$9 billion of inflow in September, as gold, bond, and stock funds were beneficiaries, as banks continue to cut deposit rates leading to a small reallocation to the stock market.
The Fourth Plenum kicked off with President Xi delivering the concisely-worded "Proposal of the Central Committee of the Communist Party of China on Formulating the 15th Five-Year Plan for National Economic and Social Development". The Ministry of Industry and Information Technology (MIIT) held a conference focused on excess capacity in the cement industry.
Concidentaly, China’s crude steel production declined -4.6% year-over-year (YoY) to 73.49 million tons, brining the year-to-date (YTD) output down by -2.9% YoY. The next Five-Year Plan will heavily emphasize science and technology, though it will be interesting to see whether the anti-involution campaign will be included in the Plan. Fitch Ratings said the anti-involution campaign could improve the credit profile of the companies, as they benefit from “output rationalization”, i.e. curbing excess production.
Bloomberg is reporting mainland listed Sany Heavy Industry will list in Hong Kong, after raising $1.6 billion.
I’ve always respected the intellectual capital of sell side analysts and sales traders. JP Morgan hosts an institutional investor conference around the IMF and World Bank meetings, which includes a survey of the 300+ attendees’ views on markets and their allocations. I’m not going to give away their intellectual capital though their question on China allocations is absurdly low. The percentage of respondents who hold zero China is between 33% to 50%. The percentage of attendees who were overweight China is tiny!
China stocks bottomed in January of 2024, and they still hold zero China? This shows the amount of capital not participating in the rally due to the geopolitical and media narrative. I would argue this is predominantly a US institutional investor as I head back to the airport again to visit with institutional investors outside of the US. The re-rating of Chinese stocks is arguably in the early days based on this survey, China’s weight in MSCI indexes, and professional investor allocations, which we access via Copley Fund Research.
I am rooting for a successful Trump-Xi meeting in South Korea next week for many reasons.
Last Night’s Performance
| Country / Index | Ticker | 1-Day Change |
|---|---|---|
| China (Hong Kong) | HSI Index | 2.4% |
| Hang Seng Tech | HSTECH Index | 3% |
| Hong Kong Turnover | HKTurn Index | -24% |
| Hong Kong Short Sale Turnover | HKSST Index | -35.3% |
| Short Turnover as a % of Hong Kong Turnover | N/A | 14.4% |
| Southbound Stock Connect Net Buy/Sell (US $ Millions) | N/A | -341.01 |
| China (Shanghai) | SHCOMP Index | 0.6% |
| China (Shenzhen) | SZCOMP Index | 1% |
| China (STAR Board) | Star50 Index | 0.3% |
| Mainland Turnover | .chturn Index | -10.3% |
| Northbound Stock Connect Net Buy/Sell (US $ Millions) | N/A | Not Available |
| Jing Daily China Global Luxury Index | CHINALUX Index | 1.1% |
| Japan | NKY Index | 3.4% |
| India | SENSEX Index | 0.5% |
| Indonesia | JCI Index | 2.2% |
| Malaysia | FBMKLCI Index | -0.3% |
| Pakistan | KSE100 Index | 1.4% |
| Philippines | PCOMP Index | -0.1% |
| South Korea | KOSPI Index | 1.8% |
| Taiwan | TWSE Index | 1.4% |
| Thailand | SET Index | 0.8% |
| Singapore | STI Index | -0.6% |
| Australia | AS51 Index | 0.4% |
| Vietnam | VNINDEX Index | -5.5% |
| Indicator | Hong Kong | Mainland China |
|---|---|---|
| Today's Volume as % of 1-Year Average | 101 | 103 |
| Advancing Stocks | 395 | 3701 |
| Declining Stocks | 94 | 1287 |
| Outperforming Factors | Growth, Liquidity, Buybacks | Growth, Liquidity, Momentum |
| Underperforming Factors | Value | Low Volatility |
| Top Sectors | Consumer Discretonary, Energy, Communication Services | Energy, Information Technology, Industrials |
| Bottom Sectors | Materials | Materials, Staples, Healthcare |
| Top Subsectors | Consumer Discretionary Distribution, Petroleum, Software | Forest Industry, Gas, Coal |
| Bottom Subsectors | Non Ferrous Metals, Consumer Durables/Apparel, Construction Materials | Precious Metals, Agriculture, Power Generation Equipment |
| Southbound Connect Buys | SMIC, Tencent, Xiaomi (Large), CNOOC (Small) | N/A |
| Southbound Connect Sells | Alibaba (Large), Akeso, Hua Hong Semi (Small) | N/A |
| MSCI China All Shares Index | # of Stocks | Average 1-Day Change (%) |
|---|---|---|
| Hong Kong Listed | 151 | 2.56 |
| Communication Services | 9 | 3.23 |
| Consumer Discretionary | 28 | 3.49 |
| Consumer Staples | 13 | 2.11 |
| Energy | 7 | 3.3 |
| Financials | 23 | 1.21 |
| Health Care | 13 | 1.2 |
| Industrials | 20 | 1.46 |
| Information Technology | 10 | 2.41 |
| Materials | 10 | -0.53 |
| Real Estate | 6 | 1.46 |
| Utilities | 12 | 0.96 |
| Mainland China Listed | 404 | 0.57 |
| Communication Services | 6 | 0.68 |
| Consumer Discretionary | 31 | 0.57 |
| Consumer Staples | 24 | -0.45 |
| Energy | 13 | 2.11 |
| Financials | 64 | 0.2 |
| Health Care | 31 | -0.07 |
| Industrials | 64 | 1.26 |
| Information Technology | 91 | 1.61 |
| Materials | 58 | -0.77 |
| Real Estate | 6 | 0.08 |
| Utilities | 16 | 0.08 |
| US & Hong Kong Dually Listed | Ticker | 1-Day Change (%) |
|---|---|---|
| Tencent HK | 700 HK Equity | 3.2 |
| Alibaba HK | 9988 HK Equity | 4.9 |
| JD.com HK | 9618 HK Equity | 3 |
| NetEase HK | 9999 HK Equity | 5.2 |
| Yum China HK | 9987 HK Equity | 2 |
| Baozun HK | 9991 HK Equity | 3.4 |
| Baidu HK | 9888 HK Equity | 3.7 |
| Autohome HK | 2518 HK Equity | 2.7 |
| Bilibili HK | 9626 HK Equity | 2.3 |
| Trip.com HK | 9961 HK Equity | 3.3 |
| EDU HK | 9901 HK Equity | 2.4 |
| Xpeng HK | 9868 HK Equity | 2.7 |
| Weibo HK | 9898 HK Equity | 1.9 |
| Li Auto HK | 2015 HK Equity | 1.7 |
| Nio Auto HK | 9866 HK Equity | 3.7 |
| Zhihu HK | 2390 HK Equity | 1.2 |
| KE HK | 2423 HK Equity | 2.8 |
| Tencent Music Entertainment HK | 1698 HK Equity | 2.9 |
| Meituan HK | 3690 HK Equity | 2.3 |
| Hong Kong's Most Heavily Traded by Value | 1-Day Change (%) |
|---|---|
| ALIBABA GROUP HOLDING LTD | 4.9 |
| TENCENT HOLDINGS LTD | 3.2 |
| XIAOMI CORP-CLASS B | 2.6 |
| SEMICONDUCTOR MANUFACTURI-H | 3.9 |
| MEITUAN-CLASS B | 2.3 |
| HUA HONG SEMICONDUCTOR LTD-H | 2.8 |
| POP MART INTERNATIONAL GROUP | -1.1 |
| CHINA LIFE INSURANCE CO-H | 2.4 |
| ZIJIN MINING GROUP CO LTD-H | -0.4 |
| CNOOC LTD-H | 2.3 |
| Shanghai and Shenzhen's Most Heavily Traded by Value | 1-Day Change (%) |
|---|---|
| ZHONGJI INNOLIGHT CO LTD-A | 7.9 |
| CAMBRICON TECHNOLOGIES-A | 2.7 |
| EOPTOLINK TECHNOLOGY INC L-A | 4.1 |
| VICTORY GIANT TECHNOLOGY -A | 1.9 |
| ZHEJIANG SANHUA INTELLIGEN-A | 6.4 |
| SUNGROW POWER SUPPLY CO LT-A | 3 |
| CONTEMPORARY AMPEREX TECHN-A | 2.3 |
| LUXSHARE PRECISION INDUSTR-A | 3 |
| ZTE CORP-A | -0.1 |
| FOXCONN INDUSTRIAL INTERNE-A | 3.4 |
Last Night’s Exchange Rates, Prices, & Yields
- CNY per USD 7.12 versus 7.13 Friday
- CNY per EUR 8.30 versus 8.32 Friday
- Yield on 10-Year Government Bond 1.85% versus 1.82% Friday
- Yield on 10-Year China Development Bank Bond 1.93% versus 1.91% Friday
- Copper Price 0.59%
- Steel Price 0.39%