
August Trade Data Proves China Remains The World’s Factory
5 Min. Read Time
Key News
The US’ Labor Day holiday marks the official end of summer, though light volumes could be a response to rising oil prices and US Treasury yields. AI supply chain plays listed in Japan, Korea, Taiwan and Mainland China’s Science and Technology (STAR) Board had a strong day yesterday. Meanwhile, Hong Kong struggled on light volumes.
Yesterday’s onshore STAR Board AI "picks and shovels" rally saw profit taking overnight, as semiconductors and technology hardware names were generally lower in both Hong Kong and Mainland China. While the broad Hang Seng Index closed above the 25,000 level, the Hang Seng Tech Index closed below 4,500, which had been the support level.
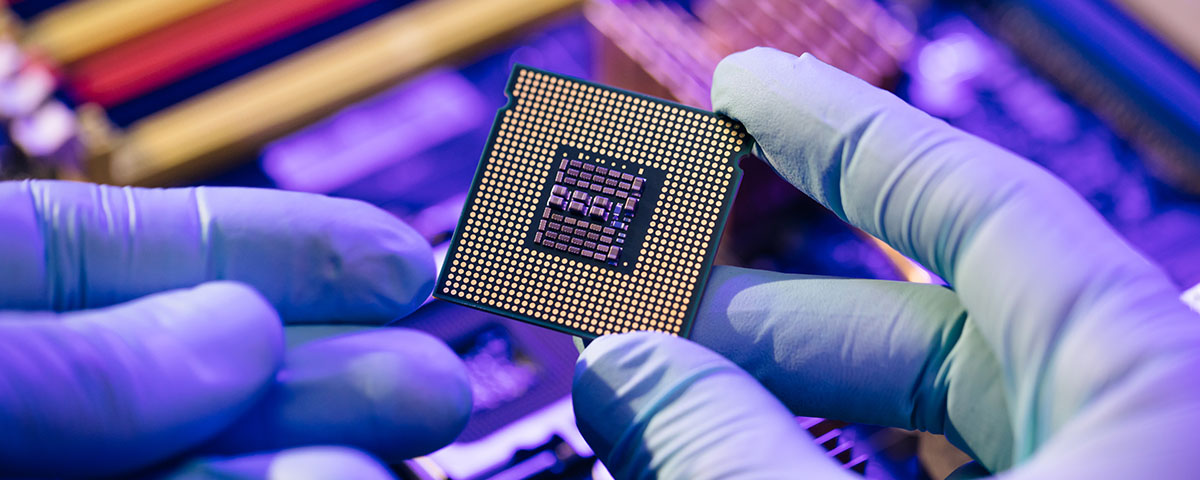
August trade data proved that China remains the world’s factory. Both exports and imports were strong as exports of “high tech products” increased +56% year-over-year (YoY), led by integrated circuit export, which increased +130% YoY in August to $40.7 billion, bringing the year-to-date (YTD) total to $256.70 billion. Other strong categories included automatic data processing equipment, which increased +76%, autos, which increased +43%, and mobile phones, which increased more than +20%.
Value sectors such as oil & gas outperformed in both Hong Kong and Mainland China. It was a quiet day overall.
AI large language model (LLM) providers had another weak day today, as more shares saw their IPO lock up periods expire. The major decliners included Z.ai, which fell -10.02%, and Minimax, which fell -5.59%, and were Hong Kong’s most heavily traded stocks by value. Baidu fell -2.02% following yesterday’s inclusion in Southbound Stock Connect, a classic buy the rumor and sell the news moment.
Mainland investors bought a very healthy $781 million worth of Hong Kong-listed stocks and ETFs overnight via Southbound Stock Connect, following yesterday’s $162 million worth of net buying.
The National Healthcare Security Administration announced migrant worker healthcare will be expanded. The lack of social safety net is a factor in China’s very high savings rate. This announcement can be seen as a small step in the right direction.
India will host the BRICS Summit this weekend.
August 2026 Trade Data Overview
% changes are YoY
- Imports +28.2% versus July’s +27.5% and expectations of 31%
- Exports +25% versus July’s 23.9% and expectations of 25.9%
- Trade Balance $119 billion versus July’s $112 billion and expectations of $119 billion
Last Night's Performance
| Country / Index | Ticker | 1-Day Change |
|---|---|---|
| China (Hong Kong) | HSI Index | -0.4% |
| Hang Seng Tech | HSTECH Index | -1.6% |
| Hong Kong Turnover | HKTurn Index | -1.7% |
| Hong Kong Short Sale Turnover | HKSST Index | 17.1% |
| Short Turnover as a % of Hong Kong Turnover | N/A | 0.2 |
| Southbound Stock Connect Net Buy/Sell (US $ Millions) | N/A | 782.61 |
| China (Shanghai) | SHCOMP Index | 0.2% |
| China (Shenzhen) | SZCOMP Index | -0.1% |
| China (STAR Board) | Star50 Index | -1.5% |
| Mainland Turnover | .chturn Index | 1.1% |
| Japan | NKY Index | -1.7% |
| India | SENSEX Index | -0.7% |
| Indonesia | JCI Index | 1% |
| Malaysia | FBMKLCI Index | 0% |
| Pakistan | KSE100 Index | -0.6% |
| Philippines | PCOMP Index | 0.4% |
| South Korea | KOSPI Index | -0.6% |
| Taiwan | TWSE Index | -0.5% |
| Thailand | SET Index | 0.2% |
| Singapore | STI Index | -0.4% |
| Australia | AS51 Index | -1% |
| Vietnam | VNINDEX Index | 0.5% |
| Indicator | Hong Kong | Mainland China |
|---|---|---|
| Today's Volume % of 1-Year Average | 76 | 79 |
| Advancing Stocks | 260 | 3253 |
| Declining Stocks | 296 | 1783 |
| Outperforming Factors | Low Volatility, Dividend Yield, Quality | Value, Low Volatility, Dividend Yield |
| Underperforming Factors | Growth, Liquidity, EPS Revision | Growth, Liquidity, ESG Score |
| Top Sectors | Energy, Materials, Utilities | Energy, Materials, Real Estate |
| Bottom Sectors | Tech, Financials, Communication | Industrials, Tech, Discretionary |
| Top Subsectors | Petroleum, Coal, Non Ferrous Metal | Fertilizer/Pesticide, Oil/Gas, Comprehensive |
| Bottom Subsectors | Tech Hardware, Semis, Electrical Equipment | Computer Hardware, Electric Power Grid, Semis |
| Southbound Connect Buys | Xiaomi, YOFC (Moderate), CNOOC, KB Laminates (Small) | N/A |
| Southbound Connect Sells | SMIC (Moderate), Minimax, Z AI (Small) | N/A |
| MSCI China All Shares Index | # of Stocks | Average 1-Day Change (%) |
|---|---|---|
| Hong Kong Listed | 165 | -0.3 |
| Communication Services | 11 | -0.73 |
| Consumer Discretionary | 28 | -0.05 |
| Consumer Staples | 13 | -0.06 |
| Energy | 6 | 3.45 |
| Financials | 25 | -0.88 |
| Health Care | 16 | 0.82 |
| Industrials | 22 | -0.63 |
| Information Technology | 12 | -3.56 |
| Materials | 14 | 2.83 |
| Real Estate | 7 | 1.25 |
| Utilities | 11 | 2.48 |
| Mainland China Listed | 386 | -0.19 |
| Communication Services | 8 | -0.09 |
| Consumer Discretionary | 26 | -0.55 |
| Consumer Staples | 19 | -0.42 |
| Energy | 12 | 1.01 |
| Financials | 64 | 0.03 |
| Health Care | 31 | 0.08 |
| Industrials | 58 | -0.76 |
| Information Technology | 95 | -0.61 |
| Materials | 52 | 0.87 |
| US & Hong Kong Dually Listed | Ticker | 1-Day Change (%) |
|---|---|---|
| Tencent HK | 700 HK Equity | -0.7 |
| Alibaba HK | 9988 HK Equity | -0.1 |
| JD.com HK | 9618 HK Equity | -0.2 |
| NetEase HK | 9999 HK Equity | 0.3 |
| Yum China HK | 9987 HK Equity | -0.3 |
| Baozun HK | 9991 HK Equity | -2.5 |
| Baidu HK | 9888 HK Equity | -2 |
| Autohome HK | 2518 HK Equity | 1.6 |
| Bilibili HK | 9626 HK Equity | 0.2 |
| Trip.com HK | 9961 HK Equity | -0.7 |
| EDU HK | 9901 HK Equity | -0.2 |
| Xpeng HK | 9868 HK Equity | 0.9 |
| Weibo HK | 9898 HK Equity | -0.5 |
| Li Auto HK | 2015 HK Equity | -2.1 |
| Nio Auto HK | 9866 HK Equity | -1.2 |
| Zhihu HK | 2390 HK Equity | -0.6 |
| KE HK | 2423 HK Equity | 0.1 |
| Tencent Music Entertainment HK | 1698 HK Equity | 0.7 |
| Meituan HK | 3690 HK Equity | 0.7 |
| Hong Kong's Most Heavily Traded by Value | 1-Day Change (%) |
|---|---|
| Z AI CO LTD | -10 |
| MINIMAX GROUP INC | -5.6 |
| SEMICONDUCTOR MANUFACTURI-H | -4.3 |
| ALIBABA GROUP HOLDING LTD | -0.1 |
| XIAOMI CORP-CLASS B | -2.1 |
| TENCENT HOLDINGS LTD | -0.7 |
| YANGTZE OPTICAL FIBRE AND-H | -2.3 |
| LENOVO GROUP LTD | -6.2 |
| KINGBOARD LAMINATES HLDG LTD | -3.9 |
| CNOOC LTD-H | 3.9 |
| Shanghai and Shenzhen's Most Heavily Traded by Value | 1-Day Change (%) |
|---|---|
| VISUAL CHINA GROUP CO LTD-A | 1.8 |
| SHANTUI CONSTRUCTION MACHI-A | 1.2 |
| ZHONGJI INNOLIGHT CO LTD-A | 0.4 |
| CONTEMPORARY AMPEREX TECHN-A | -3.7 |
| EOPTOLINK TECHNOLOGY INC L-A | -0.2 |
| GIGADEVICE SEMICONDUCTO-CL A | 0.1 |
| CXMT CORP-A | -0.1 |
| SHENZHEN FASTPRINT CIRCUIT-A | 9.2 |
| SUZHOU DONGSHAN PRECISION-A | -2.2 |
| CIG SHANGHAI CO LTD-A | 7.3 |
Last Night's Exchange Rates, Prices, & Yields
- CNY per USD 6.71 versus 6.71 yesterday
- CNY per EUR 7.79 versus 7.80 yesterday
- Yield on 10-Year Government Bond 1.68% versuss 1.68% yesterday
- Yield on 10-Year China Development Bank Bond 1.76% versus 1.76% yesterday
- Copper Price 0.96%
- Steel Price 0.16%